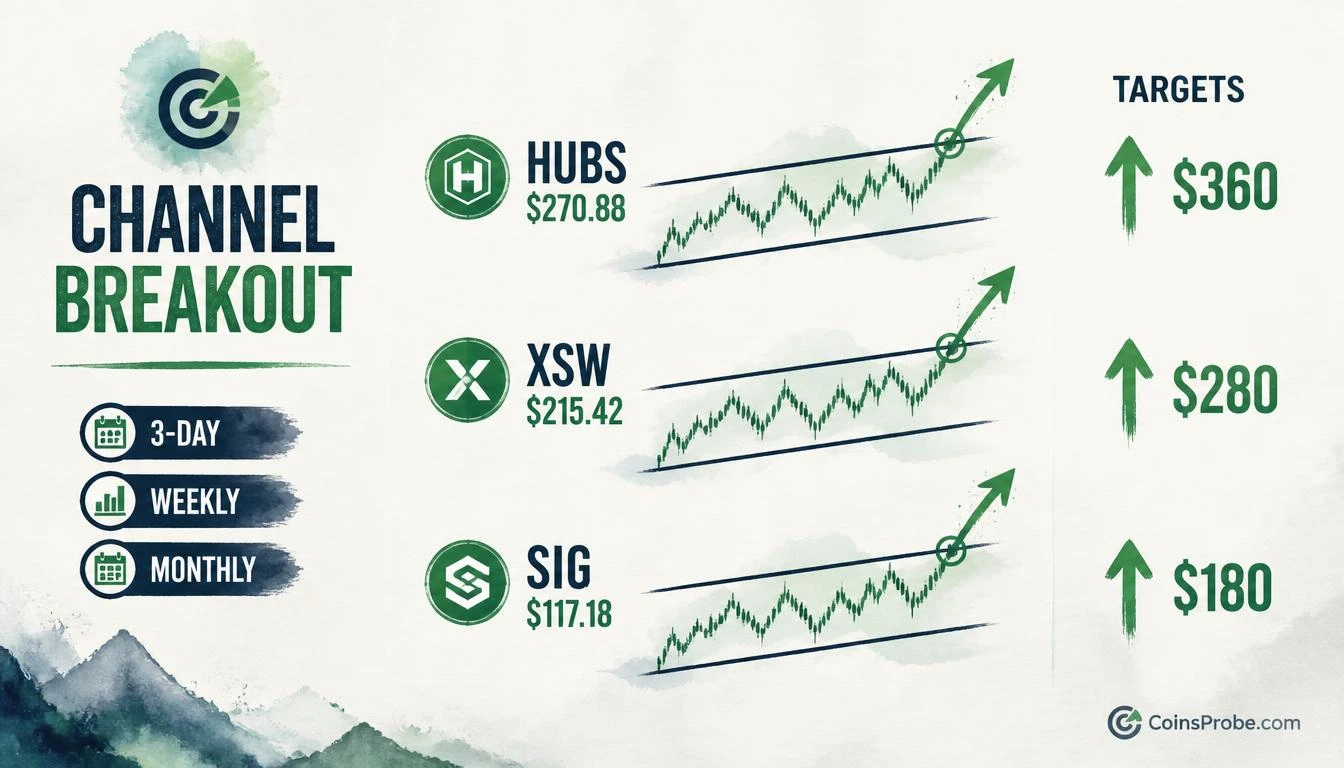

- HUBS confirmed 3-day channel breakout above $262 — current price $270.88, target $360 (+33%) per @alicharts
- XSW cleared a weekly channel forming since July 2024 — targets $240 then $280 (+30%), key sustain level $206
- SIG at $117.18 awaiting monthly close confirmation above $112 — targets $150 then $180 (+50%)
Three equities are flashing simultaneous channel breakouts across multiple timeframes — a setup that analyst Ali Martinez (@alicharts) flagged in a five-part thread on October 26, 2026. HubSpot ($HUBS) has confirmed a breakout on its 3-day chart, the SPDR S&P Software & Services ETF ($XSW) has cleared a weekly channel in place since July 2024, and Signet Jewelers ($SIG) is approaching a monthly close confirmation above its own multi-month range. All three patterns share the same structure: horizontal channel compression followed by a push above upper resistance — a sequence that, when confirmed, historically signals a sustained directional move.
Martinez identified each setup individually, with targets, intermediate resistance levels, and confirmation requirements specific to each asset’s timeframe. The analysis is purely price-structure based — no on-chain metrics, no macro indicators. The thesis rests entirely on the integrity of the channel breaks and the ability of price to sustain above the broken resistance levels.
Signal 1 — HubSpot ($HUBS): 3-Day Channel Breakout Above $262
HubSpot has broken out of a horizontal channel on its three-day chart, closing above the upper channel boundary near $262. The chart shared by Martinez shows price had oscillated within this structure across multiple candles before the most recent 3-day close pushed decisively above that upper boundary. Per the chart analysis, the current price of $270.88 is now sitting visibly above that resistance line — the breakout is confirmed, not speculative.
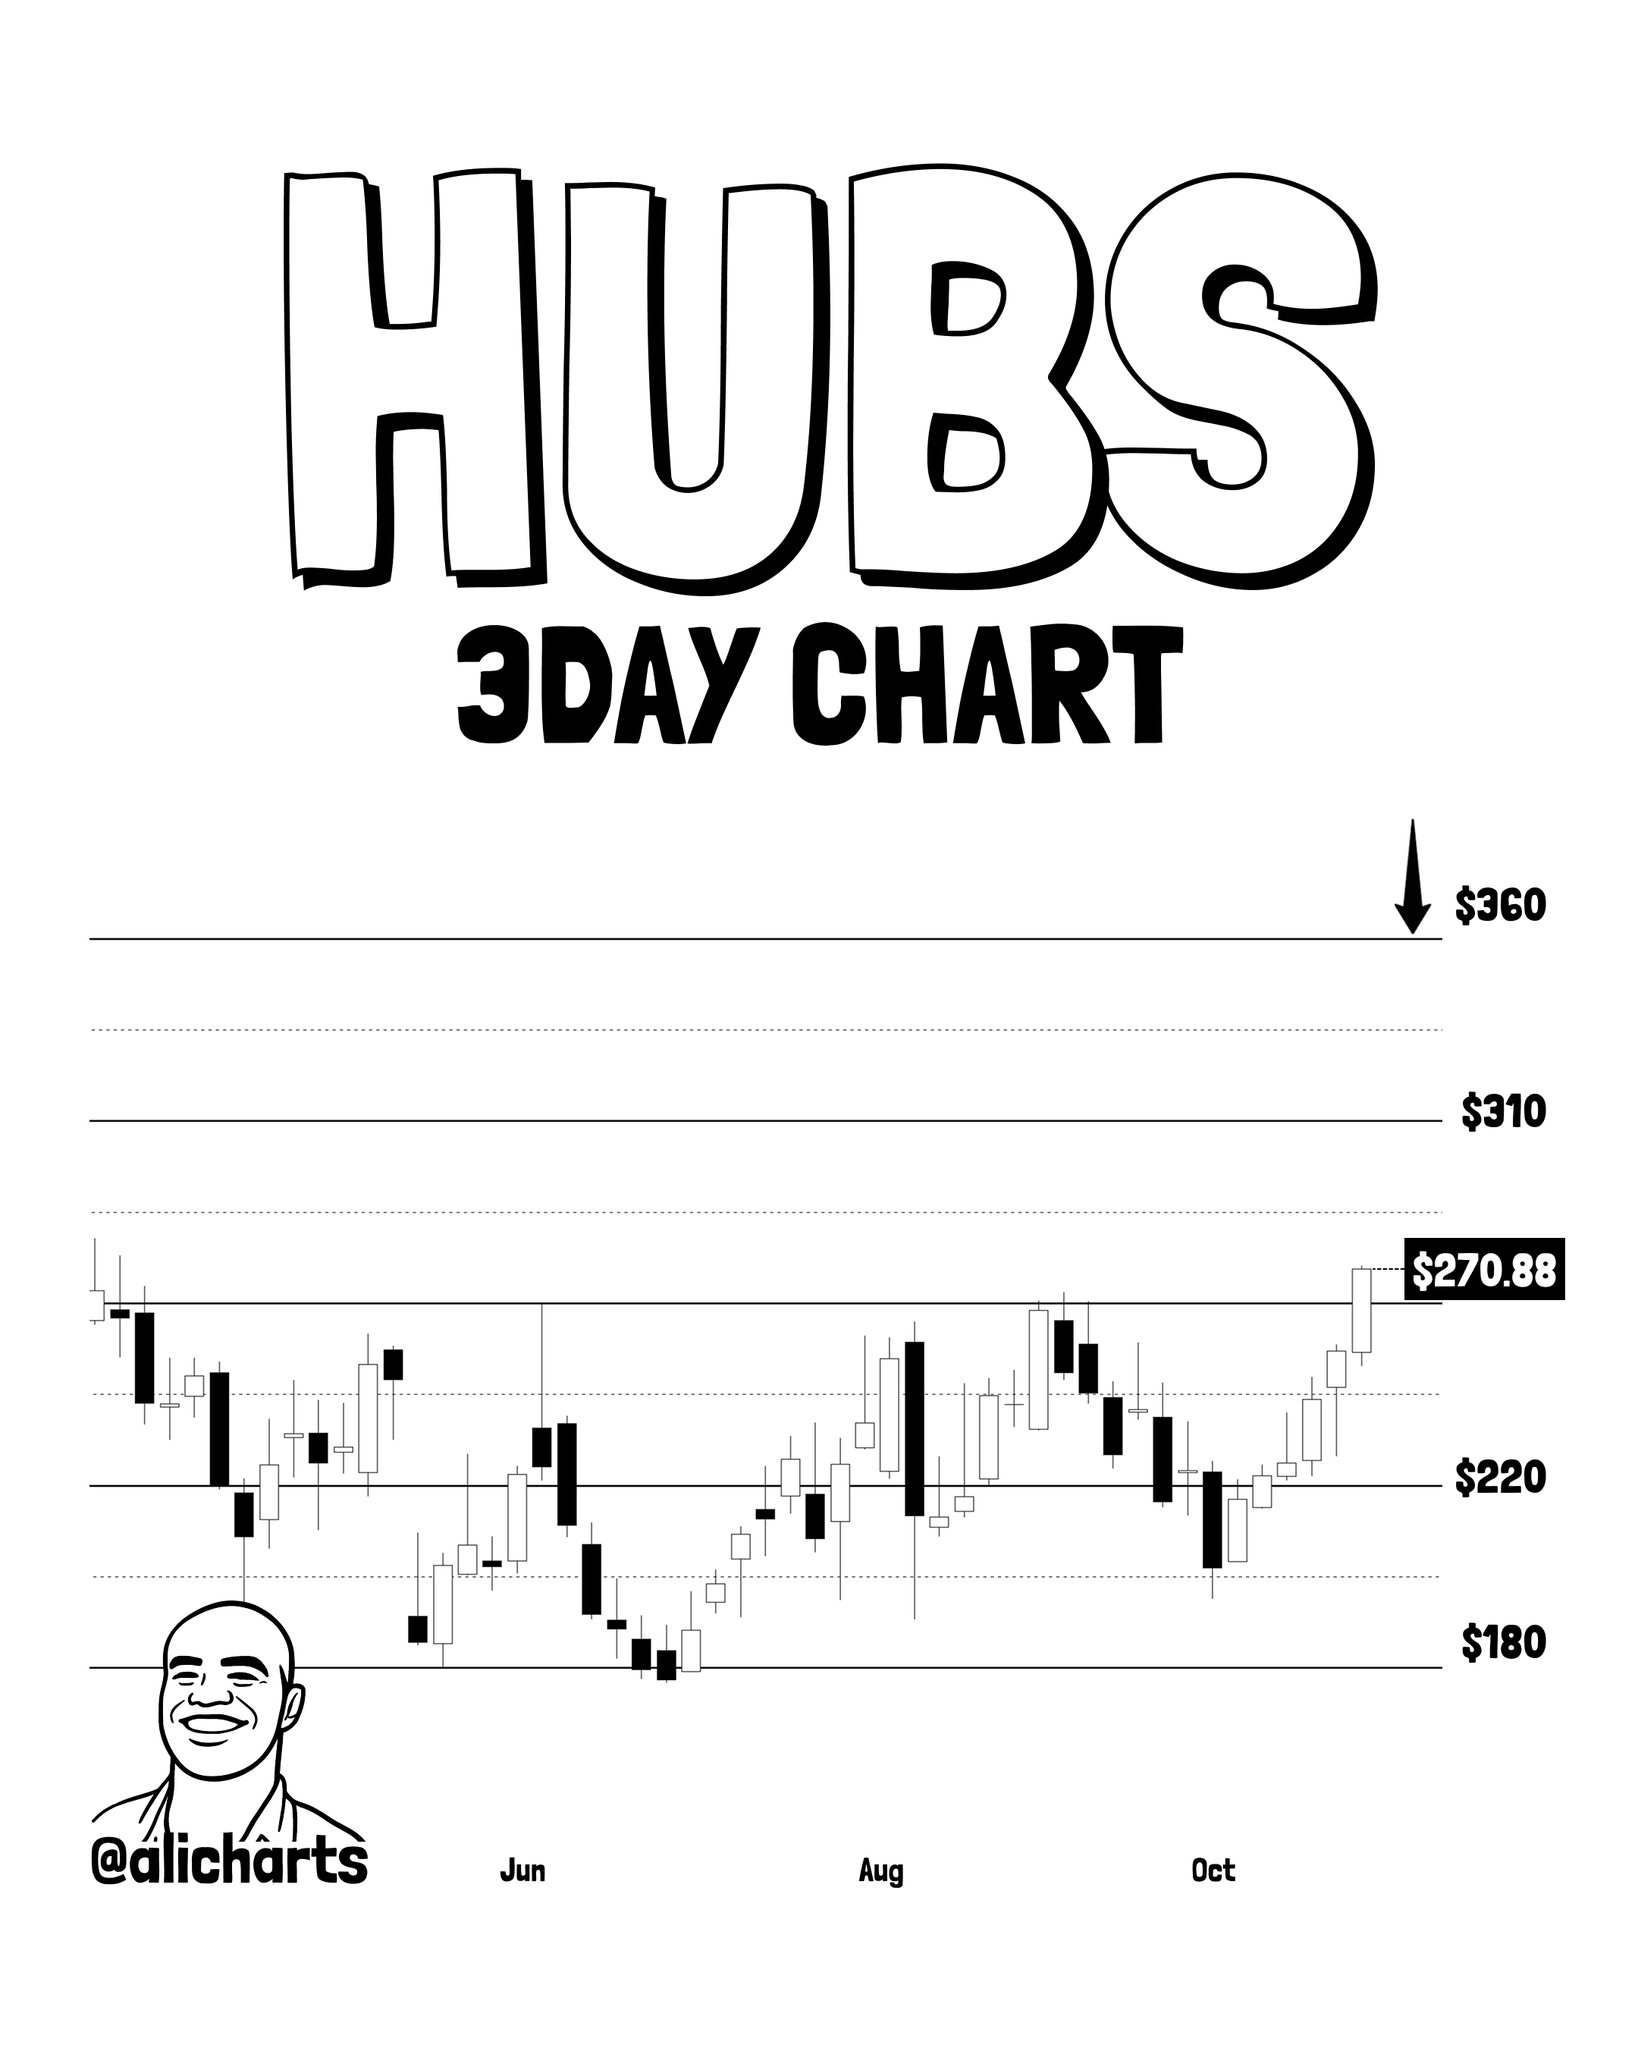
Martinez’s stated target from the pattern is $360, representing a projected 33% rally from the breakout level near $262. He flags $310 as an intermediate resistance zone that could slow momentum before the final target is reached. The move from current levels ($270.88) to $360 represents approximately +33% upside if the pattern completes without invalidation.
Bullish Scenario
Price sustains above $262 on a closing basis, clears $310 intermediate resistance, and advances to the pattern target of $360 — a +33% move from the breakout level per Martinez’s analysis.
Bearish Scenario
A weekly close back below $262 would indicate a failed breakout and a return into the channel range, negating the pattern’s directional signal.
Signal 2 — XSW (SPDR S&P Software & Services ETF): Weekly Channel Break Since July 2024
The second setup is $XSW — the State Street SPDR S&P Software & Services ETF. Price has moved above the upper boundary of a weekly channel that had been forming since July 2024, making this the longer-developing of the three structures. The weekly chart shows the current price at $215.42 sitting above the channel’s upper boundary, with price now positioned below $240 but above the broken resistance zone. The breakout is confirmed on current price structure, though Martinez’s note carries a caveat: he is watching for the breakout to sustain on weekly closing prices above $206.
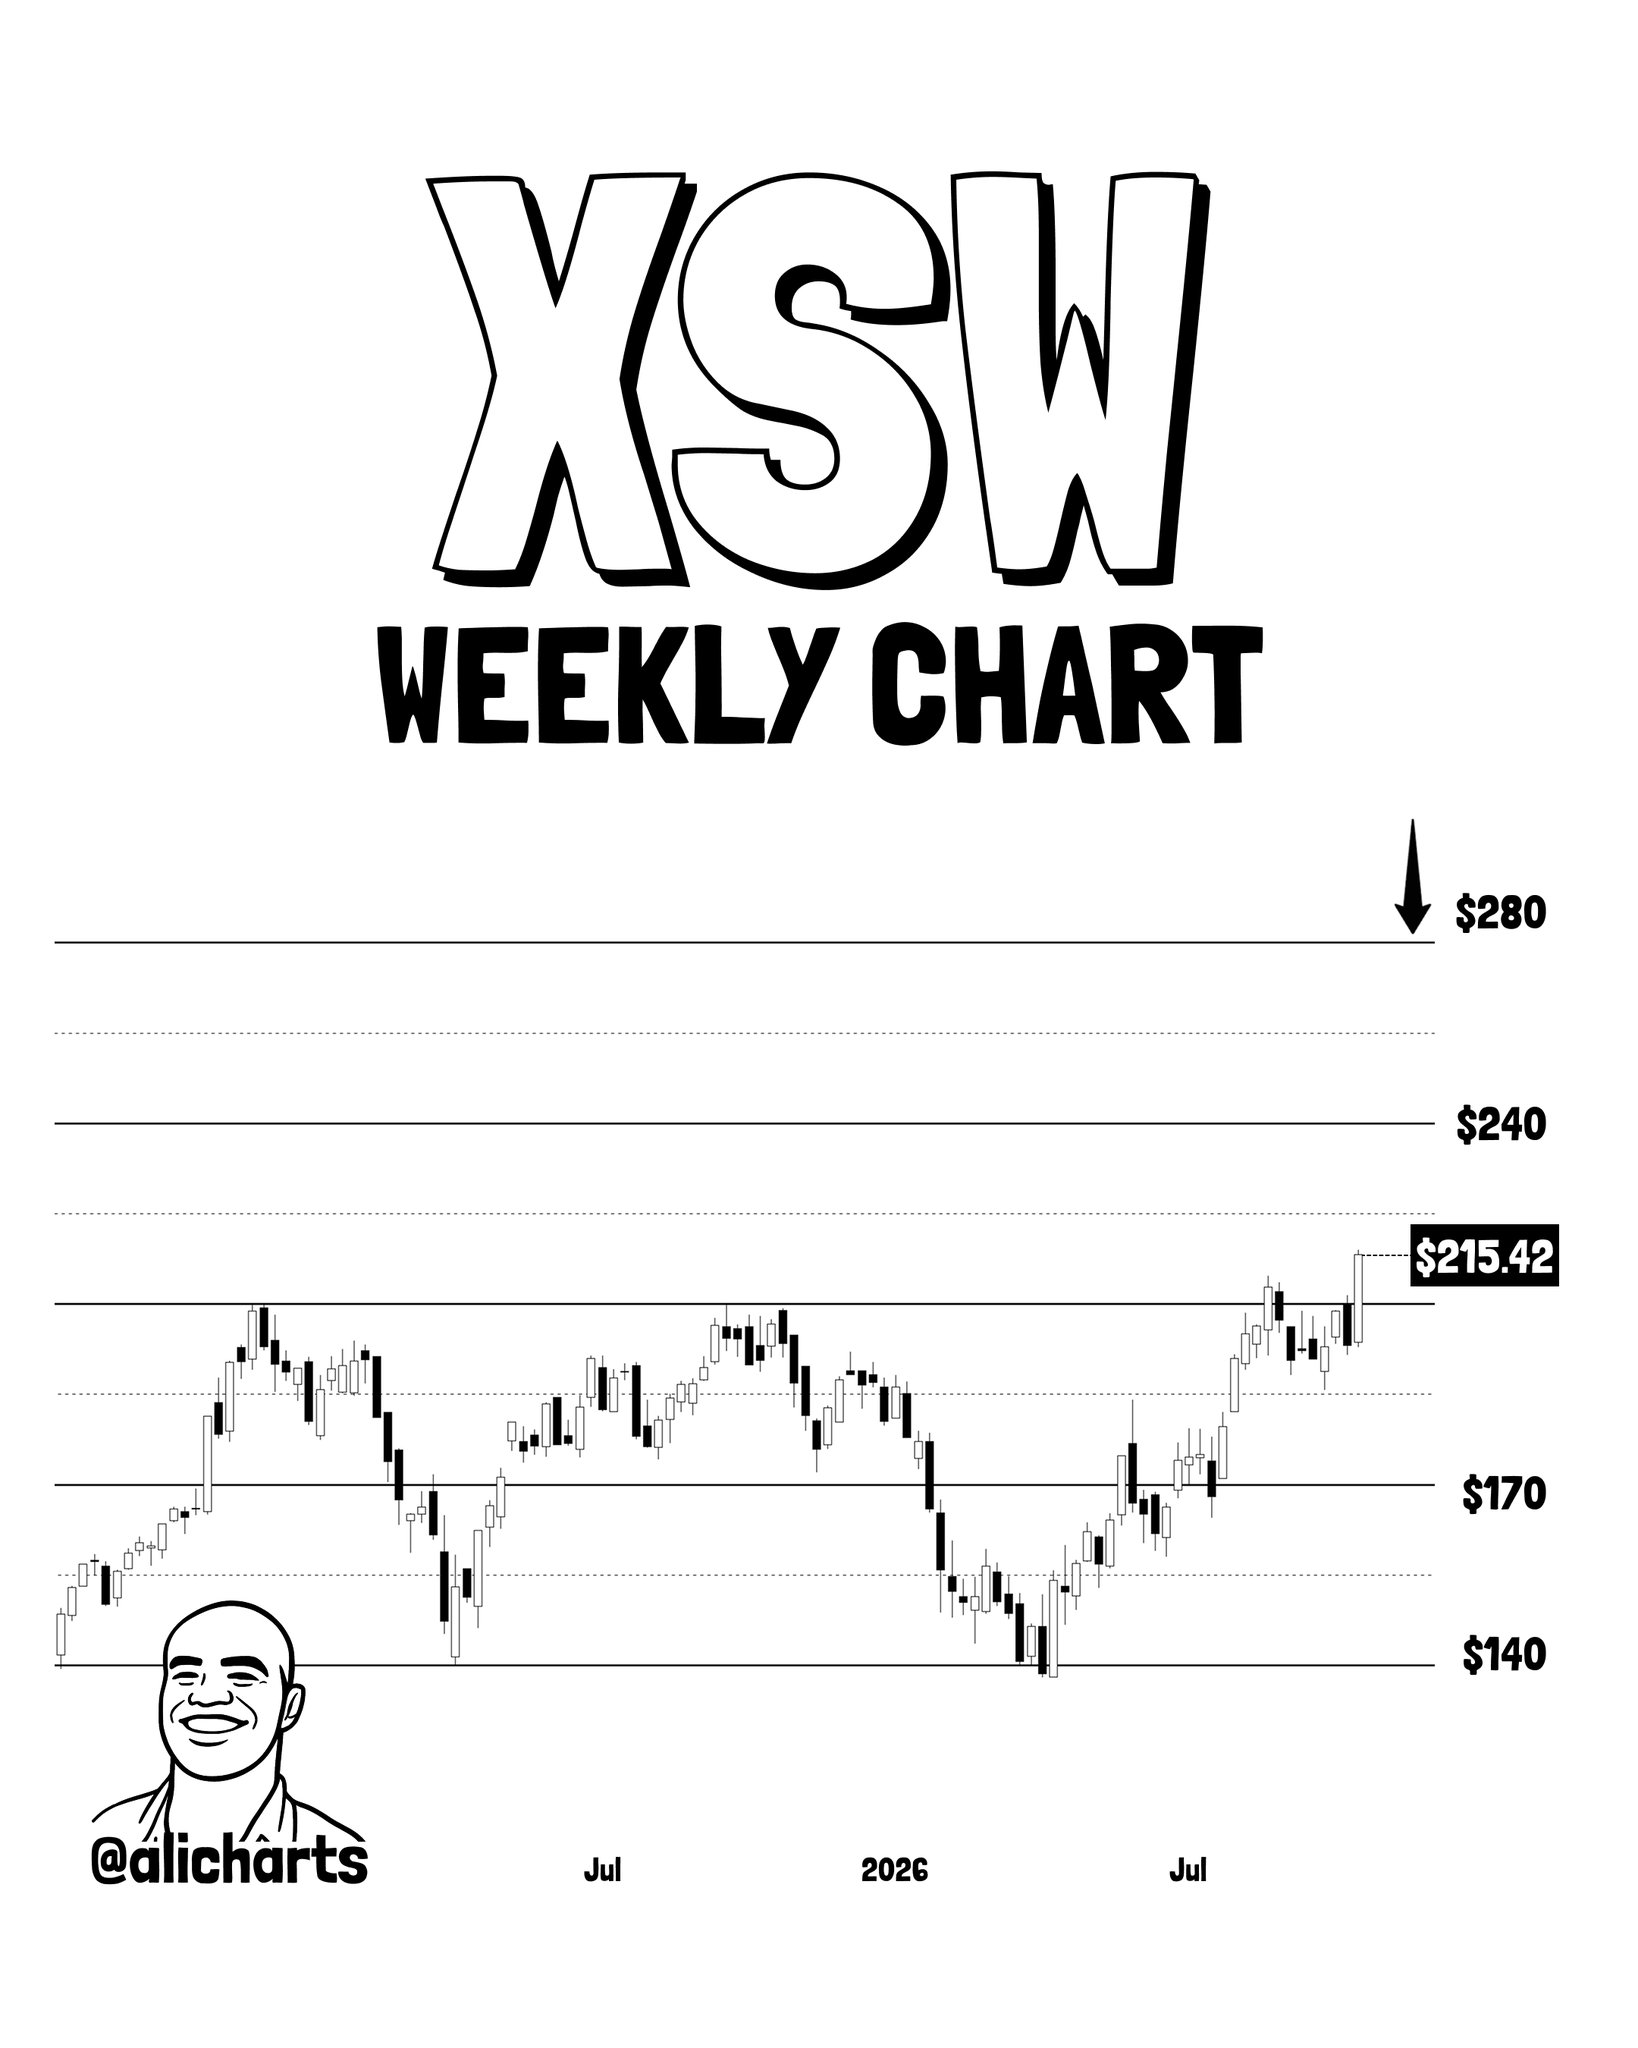
The intermediate target is $240, with a secondary target at $280 — representing approximately +30% from the breakout level. The multi-month duration of the base (July 2024 to present) is relevant context: longer base formations typically generate proportionally larger measured moves when resolved, though Martinez does not attach a historical precedent rate to this observation.
Bullish Scenario
Weekly closes hold above $206, price advances through $240 intermediate resistance, and the pattern completes toward $280 — approximately +30% from the breakout zone per Martinez’s targets.
Bearish Scenario
Failure to sustain weekly closes above $206 would signal a breakdown back into the channel and invalidate the breakout thesis.
Signal 3 — Signet Jewelers ($SIG): Monthly Channel Close Pending Above $112
The third setup operates on the longest timeframe of the three. Signet Jewelers ($SIG) is approaching a monthly close above the upper boundary of its horizontal channel near $112. The monthly chart shows a current price label of $117.18 positioned above the channel’s previously established resistance zone — the latest monthly candle has spiked above the boundary. The chart analysis confirms the breakout is occurring, with $117.18 sitting visibly above the channel’s upper boundary line.
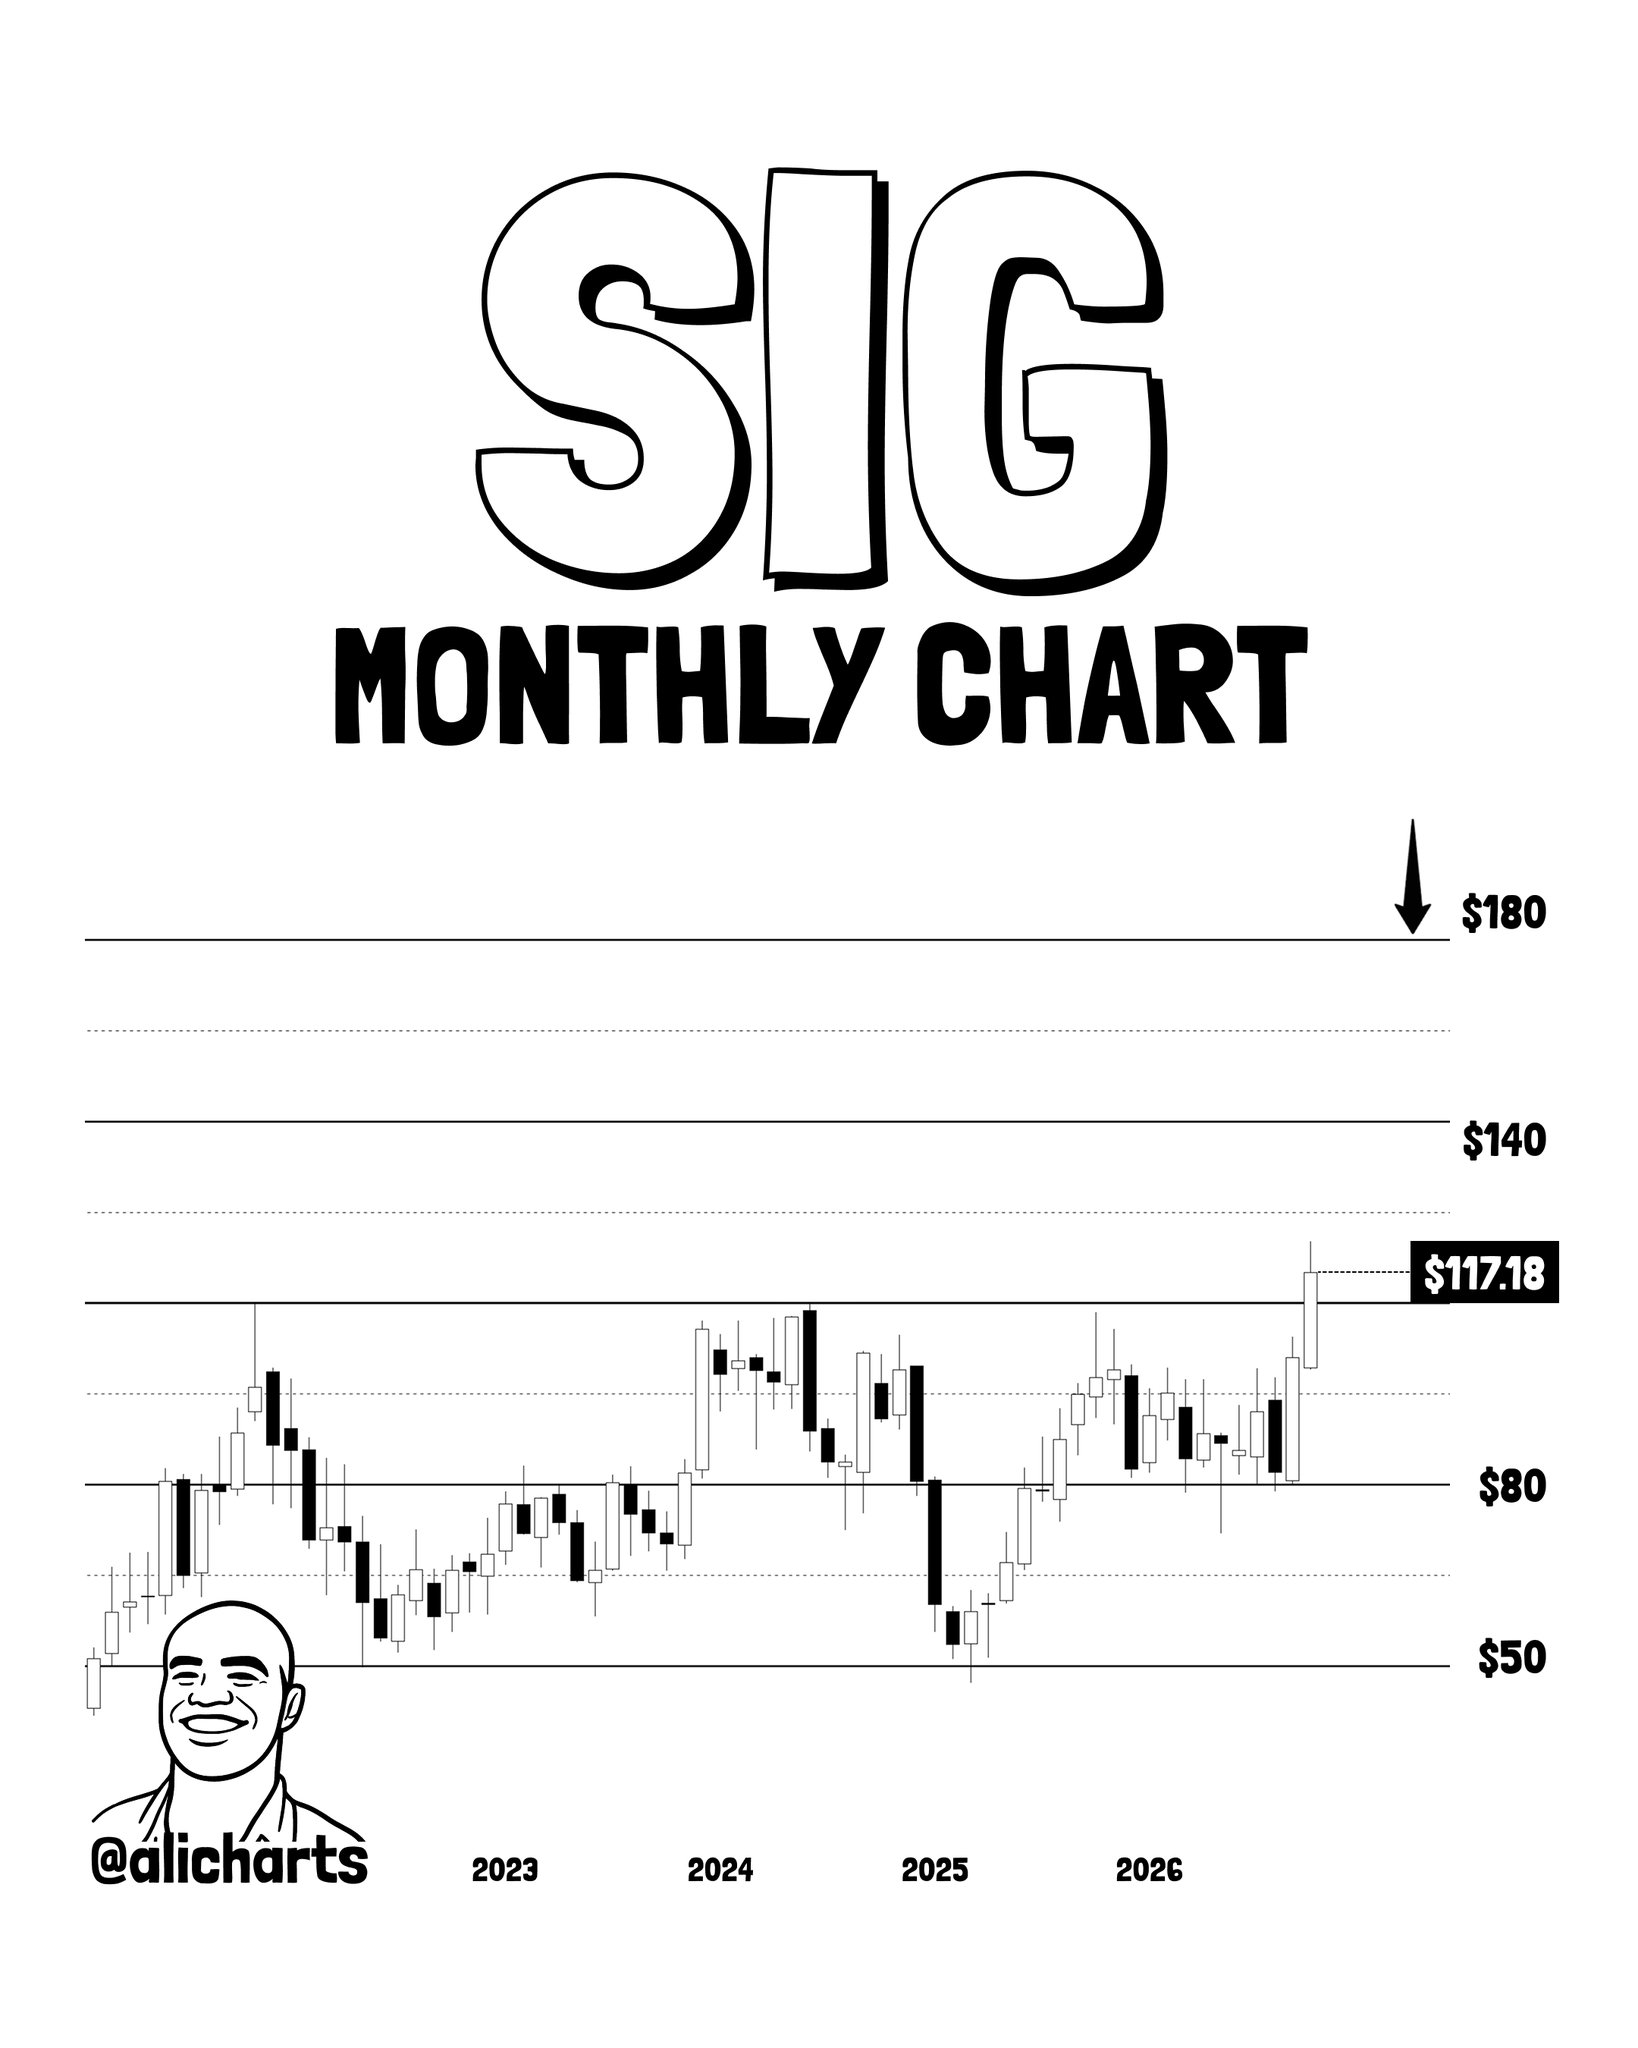
Martinez’s stated condition here is important: he requires the month to close above approximately $112 for full confirmation. This distinguishes SIG from HUBS and XSW, where the breakouts are already confirmed on 3-day and weekly closes respectively. For SIG, the confirmation event is the pending monthly close. If that close is achieved, the pattern targets are $150 as the first resistance level, followed by $180 as the upper target — representing approximately +50% from the breakout level near $112 to the final target.
Bullish Scenario
Monthly close above $112 confirms the breakout, price advances to $150 intermediate resistance, and the pattern targets $180 — approximately +50% from the channel breakout level per Martinez’s analysis.
Bearish Scenario
A monthly close back below $112 would mean the breakout attempt failed at the confirmation stage, returning SIG to channel-range trading and negating the pattern.
Why Three Simultaneous Timeframe Breakouts Matter
The three setups — 3-day, weekly, and monthly — represent three independent compression cycles resolving in the same directional manner within the same observation window. Martinez does not claim a macro correlation between these names; HubSpot is a CRM software company, XSW is a broad software-sector ETF, and Signet Jewelers is a specialty retailer. The common thread is purely structural: price had been range-bound within defined horizontal channels and has now broken above in each case. Whether this reflects broader sector rotation into growth and discretionary names, or is three independent setups coinciding, the analysis presented is price-structure only.
The confirmation hierarchy across the three setups is worth noting: HUBS has a confirmed 3-day close above $262 (current price $270.88), XSW has a confirmed price position above its weekly channel boundary (current $215.42) with Martinez watching for sustained weekly closes above $206, and SIG requires a monthly closing confirmation above $112 with current price at $117.18. Traders watching these names should calibrate position sizing accordingly — HUBS and XSW are further into confirmation, while SIG’s thesis depends on a close that has not yet been printed.
Ali Martinez (@alicharts) identified all three setups in a single five-part thread on October 26, 2026. The full price targets across the three names are $360 for HUBS, $280 for XSW, and $180 for SIG. The single most important variable across all three remains whether price can sustain closing prices above the broken channel boundaries — that distinction separates confirmed breakouts from failed ones. Watch $262 on HUBS, $206 on XSW, and the October monthly close level of $112 on SIG as the lines that keep each respective thesis intact.
Frequently Asked Questions
What does the HubSpot ($HUBS) channel breakout signal, and what is the price target?
Why does XSW require weekly closes above $206 if the breakout is already confirmed?
What is the difference between the SIG setup and the HUBS and XSW setups?
What invalidates all three breakout setups?
Source: Ali Charts · Published by CoinsProbe Markets Desk
The opinions and market insights shared on CoinsProbe represent the views of individual authors based on prevailing market conditions at the time of publication. Cryptocurrency investments carry significant risk and volatility. Readers are encouraged to conduct their own research and seek professional financial advice before making investment decisions. CoinsProbe and its contributors do not accept responsibility for financial losses or decisions made based on published content.
CoinsProbe may publish sponsored articles, affiliate links, or promotional collaborations. All sponsored material is clearly labeled to maintain transparency with our audience. Our editorial decisions remain fully independent, and advertising partnerships do not influence reviews, rankings, or published opinions.
Since 2023, CoinsProbe has delivered reliable insights on cryptocurrency, blockchain, and digital assets. Our content is created by experienced researchers and analysts who follow strict editorial standards focused on accuracy, transparency, and credibility. Every article is carefully reviewed and verified using trusted sources and current market data. We provide unbiased analysis and timely updates covering everything from emerging crypto projects to major industry developments.