
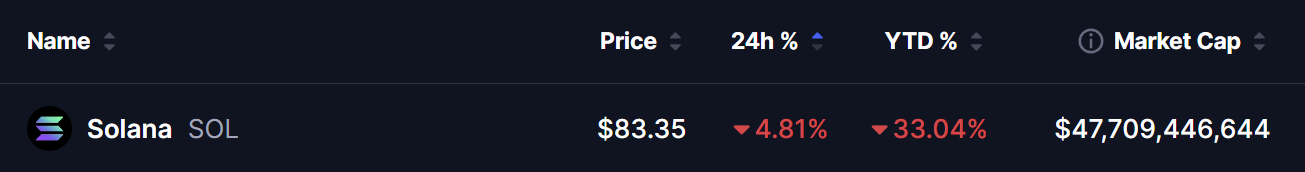
- SOL is down 4.81% in 24 hours and 33%+ year-to-date at $83.35 — pressured by a broader crypto sell-off as Bitcoin falls below $67K and Ethereum posts a near 4% decline amid rising geopolitical tensions.
- The OI-Weighted Funding Rate has been persistently negative since late January 2026 — with multiple spikes toward -0.06% to -0.07% — confirming that leveraged traders continue to bet on further downside with no clear long-side conviction returning yet.
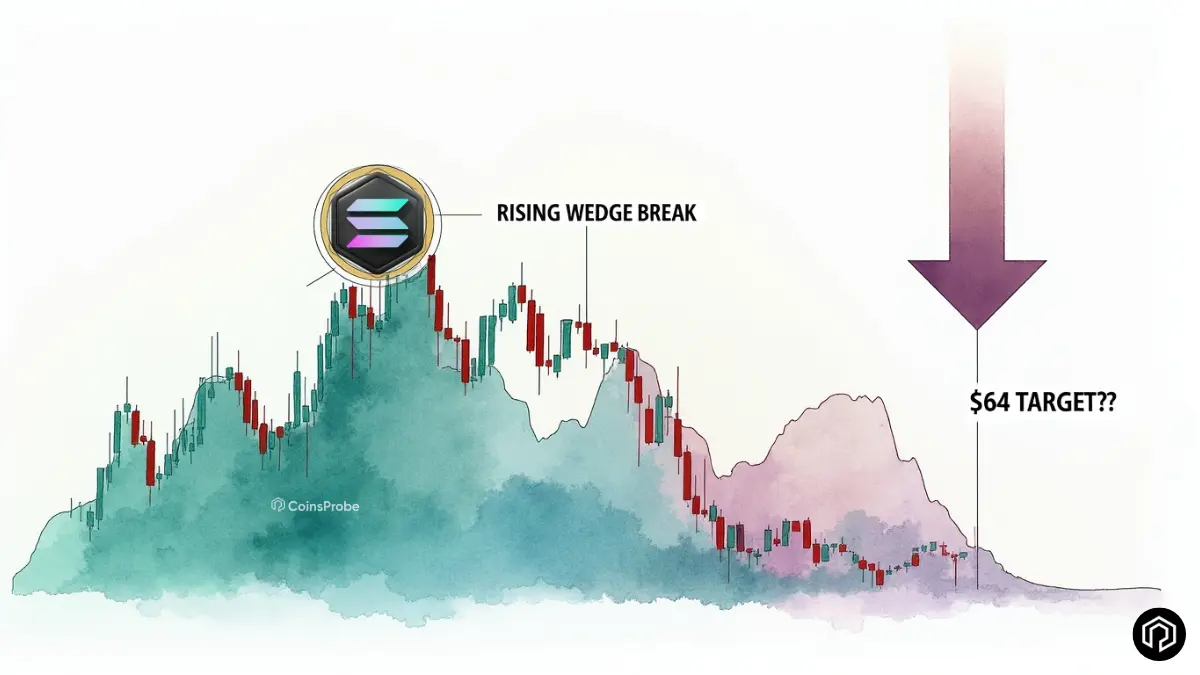
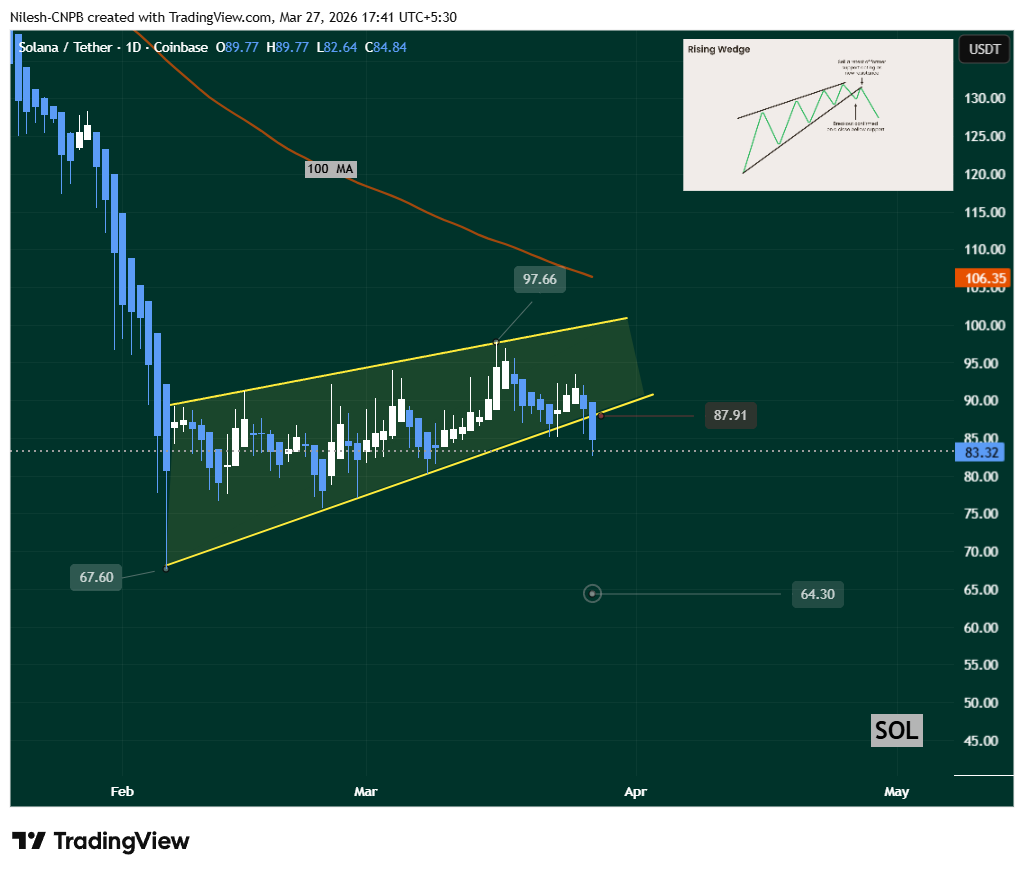
- SOL has broken down from a multi-week Rising Wedge on the daily chart — now trading well below the 100-day MA at $106.35 — with a near-term retest of the broken trendline near $87–$90 likely before continuation lower.
- A failure at the $87–$90 retest zone targets the Rising Wedge measured move of $64.23 — while only a decisive reclaim of the 100-day MA at $106.35 invalidates the bearish thesis entirely.
Solana is facing one of its most technically significant breakdowns of 2026 — with a confirmed Rising Wedge failure on the daily chart, persistently negative funding rates in the perpetuals market, and a broader risk-off environment driven by escalating Middle East tensions combining to create a challenging setup heading into April 2026.
As of March 27, 2026, SOL is trading at $83.35, down 4.81% in the past 24 hours and over 33% year-to-date, with a market capitalization of approximately $47.7 billion — currently ranked #7 among all cryptocurrencies globally.
SOL’s decline is not occurring in isolation — it is part of a broad crypto market sell-off driven by a specific and well-defined macro catalyst. Rising geopolitical tensions in the Middle East — particularly the escalating US-Iran conflict — have pushed oil prices higher and triggered a decisive risk-off shift across global markets.
As we covered in our WTI crude oil analysis, the conflict has already created some of the most extreme intraday oil market volatility of 2026. With investors rotating toward safer assets and away from high-risk speculative positions, cryptocurrency — which continues to behave as a high-beta risk asset in the current macro environment — is absorbing significant selling pressure across the board.
Bitcoin has fallen below $67K, Ethereum is down nearly 4%, and SOL at -4.81% is underperforming both — reflecting its higher beta characteristics and the additional pressure from its specific technical breakdown.
SOL’s OI-Weighted Funding Rate — Shorts Firmly in Control
The Solana OI-Weighted Funding Rate chart on the 1-hour timeframe provides one of the clearest pictures of current market sentiment in the perpetuals market — and the signal is unambiguously bearish.
What the funding rate data shows:
Persistent negative funding since late January 2026 — The funding rate has been predominantly negative for nearly two months — with multiple sharp spikes toward -0.06% to -0.07% during the most acute phases of the price breakdown. Longs have been continuously paying shorts throughout this period — a sustained dynamic that reflects genuine capital positioning toward the downside rather than short-term noise.
Deleveraging cascades amplifying spot weakness — The negative funding environment has directly coincided with SOL’s descent from the $140+ zone to current levels near $83 — as forced deleveraging of long positions amplifies the spot price decline in a self-reinforcing feedback loop.
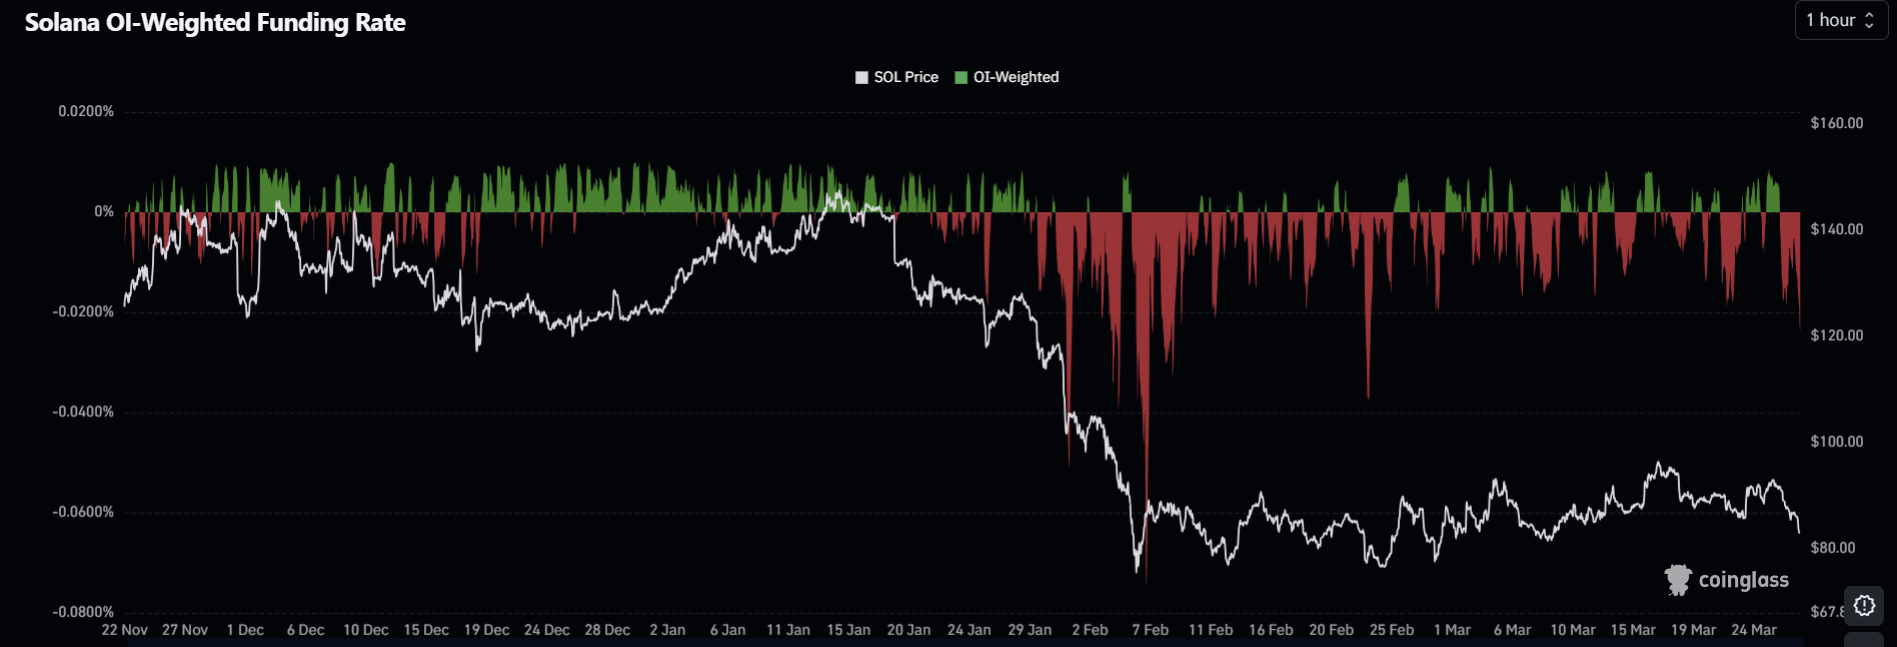
Occasional green spikes — relief rallies without conviction — Small positive funding spikes have appeared during brief relief rallies throughout the period — but the overall structure remains overwhelmingly negative, with no sustained green period that would signal a genuine shift in leveraged trader positioning.
Why OI-Weighted Funding Matters: The OI-weighted view is particularly significant because it accounts for open interest distribution — meaning the funding pressure reflects real capital positioning across the market rather than isolated noise from a small number of positions. When OI-weighted funding is persistently negative at this scale, it signals that the derivatives market is actively pricing in further downside — and that long-side conviction has not yet returned in any meaningful way.
In simple terms — the derivatives market is still pricing in more pain ahead for SOL.
SOL Technical Analysis — Rising Wedge Breakdown
The daily SOL/USDT chart on Coinbase (via TradingView) confirms a textbook bearish technical breakdown that aligns directly with the negative derivatives sentiment.
The Rising Wedge Breakdown
As we detailed, SOL’s Rising Wedge has now confirmed its breakdown — with price decisively breaching the lower trendline that had been acting as support throughout the February–March 2026 consolidation phase.
SOL is now trading well below the 100-day Moving Average at $106.35 — a level that has flipped from dynamic support to significant overhead resistance. The distance between current price ($83.35) and the 100-day MA ($106.35) represents a ~27% gap — confirming the severity of the technical deterioration.
What’s Next for SOL?
Bearish Scenario
- Near-term retest of the broken trendline at $87–$90 — the “last hurrah” before continuation lower
- Retest fails to reclaim the broken trendline on a daily closing basis — confirming resistance
- $64.23 measured move target activates — the full Rising Wedge breakdown projection
- Persistently negative OI-weighted funding continues — no long-side conviction returning
- Broader geopolitical escalation in the US-Iran conflict maintains risk-off pressure on crypto
Bullish Scenario
- A decisive daily close above the 100-day MA at $106.35 — the minimum requirement to invalidate the bearish thesis
- Reclaim of the 100-day MA signals that buyers have fully absorbed the breakdown selling pressure
- Opens the path toward $110–$120 as the first meaningful recovery targets
- Geopolitical de-escalation reduces risk-off pressure — allowing crypto to recover alongside broader risk assets
- OI-weighted funding returns to neutral or positive — confirming that leveraged trader positioning has shifted from bearish to neutral
The combination of geopolitical-driven risk-off flows, persistently negative OI-weighted funding, and a clean bearish technical breakdown creates a high-conviction downside setup for Solana in the short-to-medium term.
Frequently Asked Questions
Why is Solana down over 33% year-to-date in 2026?
SOL’s year-to-date decline reflects a combination of broader crypto market weakness, escalating US-Iran geopolitical tensions driving risk-off sentiment, and a specific technical breakdown from a multi-week Rising Wedge pattern on the daily chart. The negative OI-weighted funding rate environment since late January 2026 has amplified the spot price decline through leveraged long position liquidations.
What is the OI-Weighted Funding Rate and what does it tell us about SOL?
The OI-Weighted Funding Rate measures the cost of holding leveraged positions in perpetual futures, weighted by the open interest distribution across the market. A persistently negative rate — as seen with SOL since late January 2026 — means longs are continuously paying shorts, reflecting genuine bearish capital positioning rather than short-term noise. This sustained negative environment signals that the derivatives market is actively pricing in further SOL downside.
What is the SOL bearish price target from the Rising Wedge breakdown?
The measured move from the Rising Wedge breakdown projects to $64.23–$64.30 — calculated from the height of the wedge projected downward from the breakdown point. This target activates if the near-term retest of the broken trendline at $87–$90 fails to reclaim support on a daily closing basis.
What would invalidate the bearish SOL setup?
Only a decisive daily close above the 100-day Moving Average at $106.35 would invalidate the bearish thesis entirely — signaling that buyers have fully absorbed the selling pressure from the Rising Wedge breakdown and opening the path toward $110–$120 as initial recovery targets.
How is the US-Iran conflict affecting Solana and crypto markets?
The escalating US-Iran conflict has created a sustained risk-off environment — pushing oil prices higher and driving investors toward safer assets. Cryptocurrency, behaving as a high-beta risk asset in the current macro environment, has absorbed significant selling pressure as a result — with Bitcoin falling below $67K, Ethereum down nearly 4%, and SOL underperforming both due to its higher beta characteristics and specific technical breakdown.

The opinions and market insights shared on CoinsProbe represent the views of individual authors based on prevailing market conditions at the time of publication. Cryptocurrency investments carry significant risk and volatility. Readers are encouraged to conduct their own research and seek professional financial advice before making investment decisions. CoinsProbe and its contributors do not accept responsibility for financial losses or decisions made based on published content.
CoinsProbe may publish sponsored articles, affiliate links, or promotional collaborations. All sponsored material is clearly labeled to maintain transparency with our audience. Our editorial decisions remain fully independent, and advertising partnerships do not influence reviews, rankings, or published opinions.
Since 2023, CoinsProbe has delivered reliable insights on cryptocurrency, blockchain, and digital assets. Our content is created by experienced researchers and analysts who follow strict editorial standards focused on accuracy, transparency, and credibility. Every article is carefully reviewed and verified using trusted sources and current market data. We provide unbiased analysis and timely updates covering everything from emerging crypto projects to major industry developments.