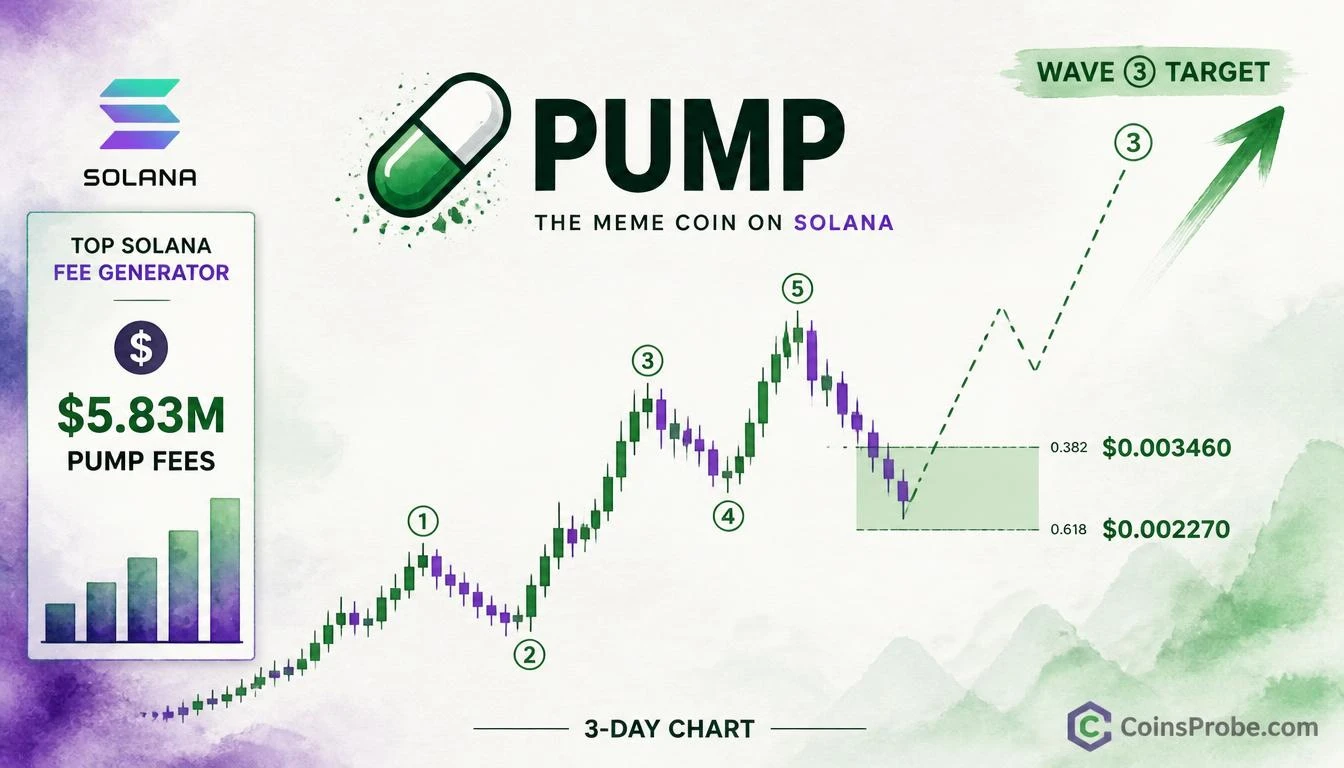

- PUMP completed a 1–5 Elliott Wave impulse on the 3-day chart per @CryptoBullet1, signaling a corrective pullback before Wave ③
- @CryptoBullet1 targets the $0.002270–$0.003460 Fibonacci retracement zone as his buy interest window
- PUMP generated $5.83M in 24-hour fees — roughly 45% of total Solana network fees of $13.02M
- Bearish RSI divergence at Wave 5 peak confirmed the pullback; $0.002270 is the key level to hold
PUMP’s Solana-native token is completing a corrective pullback after printing what analyst @CryptoBullet1 identifies as a textbook Elliott Wave 1–5 impulse on the 3-day chart — and the setup is drawing attention for a reason that goes beyond the price action: PUMP is the top fee-generating protocol on Solana.
In a post dated October 14, 2026, @CryptoBullet1 stated: “$PUMP printed a clear 1-5 impulse. Expecting explosive continuation to the upside once this correction ends. I’m interested in buying $PUMP between $0.002270–0.003460.” The analyst’s buy interest is pinned to a specific Fibonacci retracement zone visible on the 3-day chart — not a directional guess, but a structurally defined entry window.
Signal — Elliott Wave 1–5 Impulse Completed
The Elliott Wave principle counts market moves in two phases: a five-wave impulse in the direction of the primary trend, followed by a three-wave corrective pullback. The impulse phase — Waves 1 through 5 — marks a completed directional move. What follows is a retracement, typically into a Fibonacci zone, before the next impulse sequence begins. @CryptoBullet1’s 3-day chart of PUMP/USDT on Bybit shows exactly this structure: a labeled (1)–(2)–(3)–(4)–(5) sequence has completed, and the token is now inside the corrective Wave ② pullback.
The Fibonacci retracement zone identified on the chart spans the 0.382–0.618 levels, which visually correspond to the price range of $0.004838 (upper horizontal line on chart) down through $0.002270 (lower boundary of analyst’s stated buy zone). @CryptoBullet1 has narrowed his personal buy interest to the $0.002270–$0.003460 range — the lower two-thirds of that retracement band. A dashed curve on the chart projects the next move: a circled Wave ③ rally toward significantly higher prices, with an implied target timeline extending into early 2027.
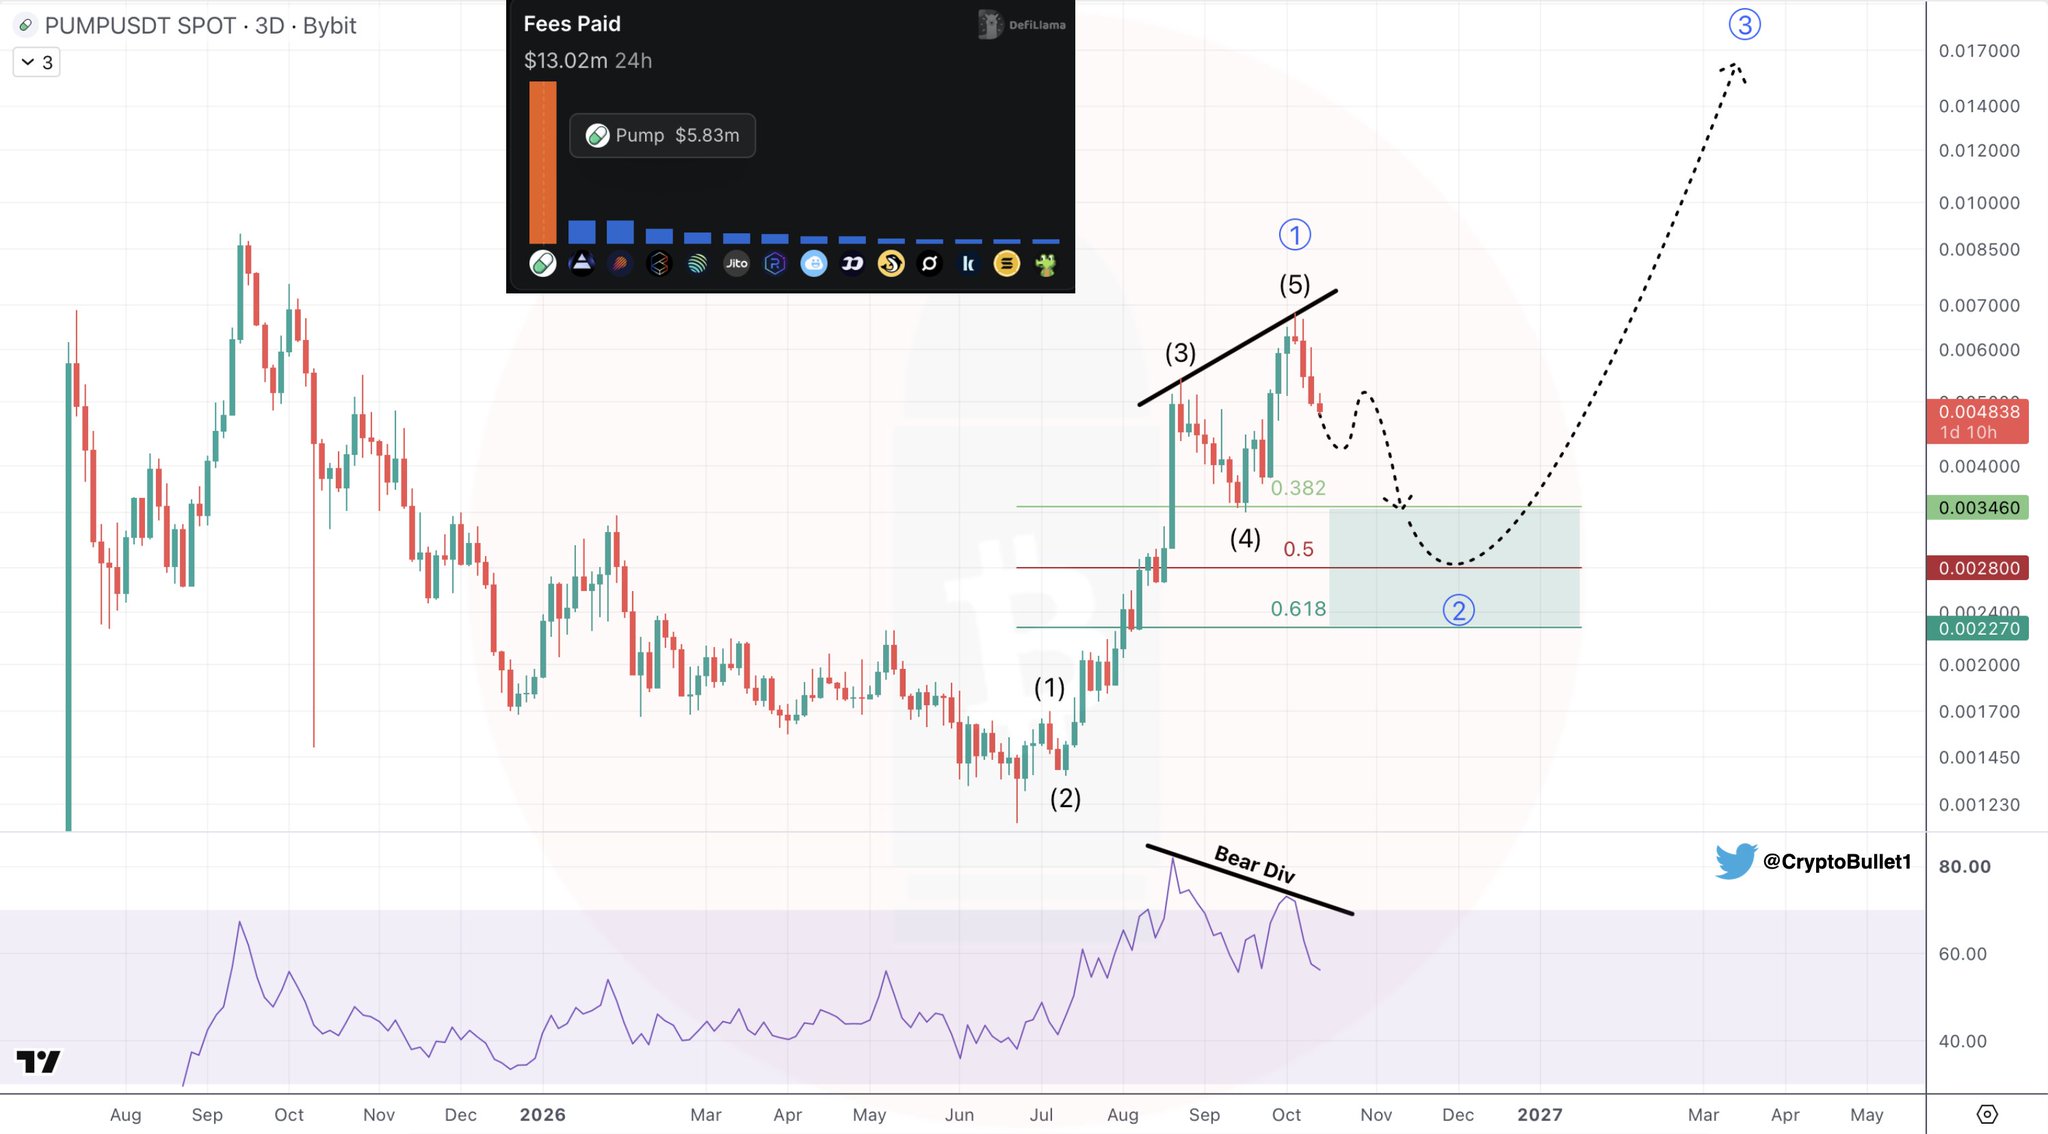
One technical caution visible on the chart: the RSI panel shows a bearish divergence annotation during the Wave 5 peak. This divergence — where price made a higher high while momentum made a lower high — is precisely what triggered the current correction. It is not a bearish signal for the medium-term thesis; it is, structurally, the mechanism that produced the pullback @CryptoBullet1 is now looking to buy into.
Why Fee Generation Makes This Structurally Different
@CryptoBullet1 opened with a statement of protocol preference: “I like protocols that generate profit.” This is not incidental framing. PUMP — the token tied to the pump.fun platform — generated $5.83 million in fees in the 24 hours captured on the chart, against a total Solana ecosystem figure of $13.02 million in 24-hour fees. That means PUMP accounted for roughly 45% of all fees across the Solana network in that snapshot — an extraordinary concentration of protocol revenue in a single application.
In a market where most tokens are priced on narrative, PUMP is priced against a real, measurable cash flow metric. That underpins why the analyst frames the corrective pullback as a buying opportunity rather than a structural breakdown. For further context on the volatility PUMP has generated around these levels, see our prior coverage of PUMP Token Drop Triggers $3.61M Liquidation Across Two Traders.
The Buy Zone — $0.002270 to $0.003460
The analyst’s stated entry window is precise:
| Level | Role | Chart Context |
|---|---|---|
| $0.003460 | Upper buy zone boundary | Horizontal support line on chart |
| $0.002800 | Mid-zone reference | Horizontal line on chart |
| $0.002270 | Lower buy zone boundary | Horizontal support line on chart |
Source: @CryptoBullet1 (X), PUMP/USDT 3-Day Chart, Bybit
@CryptoBullet1 does not state an explicit upside target in the post. The chart’s projected Wave ③ trajectory points materially higher than current levels, with the annotated wave structure suggesting continuation toward the upper price labels on the chart ($0.008500–$0.017000 range), though these are chart display levels — not analyst-stated targets. The analyst’s claim is directional and conditional: explosive continuation, but only once the correction completes and price enters the specified zone. Readers who followed @CryptoBullet1’s past PUMP trades — including a streak of 10 consecutive profitable PUMP trades documented in this space — will recognize this type of Fibonacci-anchored entry discipline.
Bullish Scenario
PUMP enters the $0.002270–$0.003460 zone, holds above $0.002270, and begins a reversal structure consistent with Wave ③ initiation. Per @CryptoBullet1’s chart projection, the next impulse sequence targets prices materially above the Wave 5 peak, with the wave count implying continuation into early 2027.
Bearish Scenario
A sustained daily close below $0.002270 — the lower boundary of the analyst’s stated buy zone — would breach the 0.618 Fibonacci retracement level and structurally invalidate the corrective-wave thesis. @CryptoBullet1 does not state a stop level, but a close below $0.002000 (the next horizontal level on the chart) would bring the wave labeling into question.
At the time of writing, the live_price data in the facts reflects the Solana (SOL) token at $104.06 (–3.67% 24h) — not PUMP’s spot price. PUMP/USDT must be tracked directly on Bybit. The chart labels show PUMP trading well above the analyst’s buy zone at time of chart publication; the correction is in progress but has not yet reached $0.003460, let alone $0.002270, based on the chart’s displayed price levels.
The thesis is simple: PUMP has completed a five-wave impulse, is correcting into a defined Fibonacci zone, generates the most fees of any Solana protocol, and @CryptoBullet1 is watching $0.002270–$0.003460 as the region where that correction becomes a buying opportunity. The fee data provides fundamental grounding. The wave structure provides the entry framework. Watch $0.002270 — a sustained break below that level is the only reading that invalidates the setup.
Frequently Asked Questions
What is the Elliott Wave buy zone @CryptoBullet1 identified for PUMP?
What invalidates the PUMP Elliott Wave bullish setup?
Why does @CryptoBullet1 emphasize PUMP’s fee generation?
What does the bearish RSI divergence on PUMP’s chart mean for the trade?
Source: Cryptobullet1 · Published by CoinsProbe Markets Desk
The opinions and market insights shared on CoinsProbe represent the views of individual authors based on prevailing market conditions at the time of publication. Cryptocurrency investments carry significant risk and volatility. Readers are encouraged to conduct their own research and seek professional financial advice before making investment decisions. CoinsProbe and its contributors do not accept responsibility for financial losses or decisions made based on published content.
CoinsProbe may publish sponsored articles, affiliate links, or promotional collaborations. All sponsored material is clearly labeled to maintain transparency with our audience. Our editorial decisions remain fully independent, and advertising partnerships do not influence reviews, rankings, or published opinions.
Since 2023, CoinsProbe has delivered reliable insights on cryptocurrency, blockchain, and digital assets. Our content is created by experienced researchers and analysts who follow strict editorial standards focused on accuracy, transparency, and credibility. Every article is carefully reviewed and verified using trusted sources and current market data. We provide unbiased analysis and timely updates covering everything from emerging crypto projects to major industry developments.