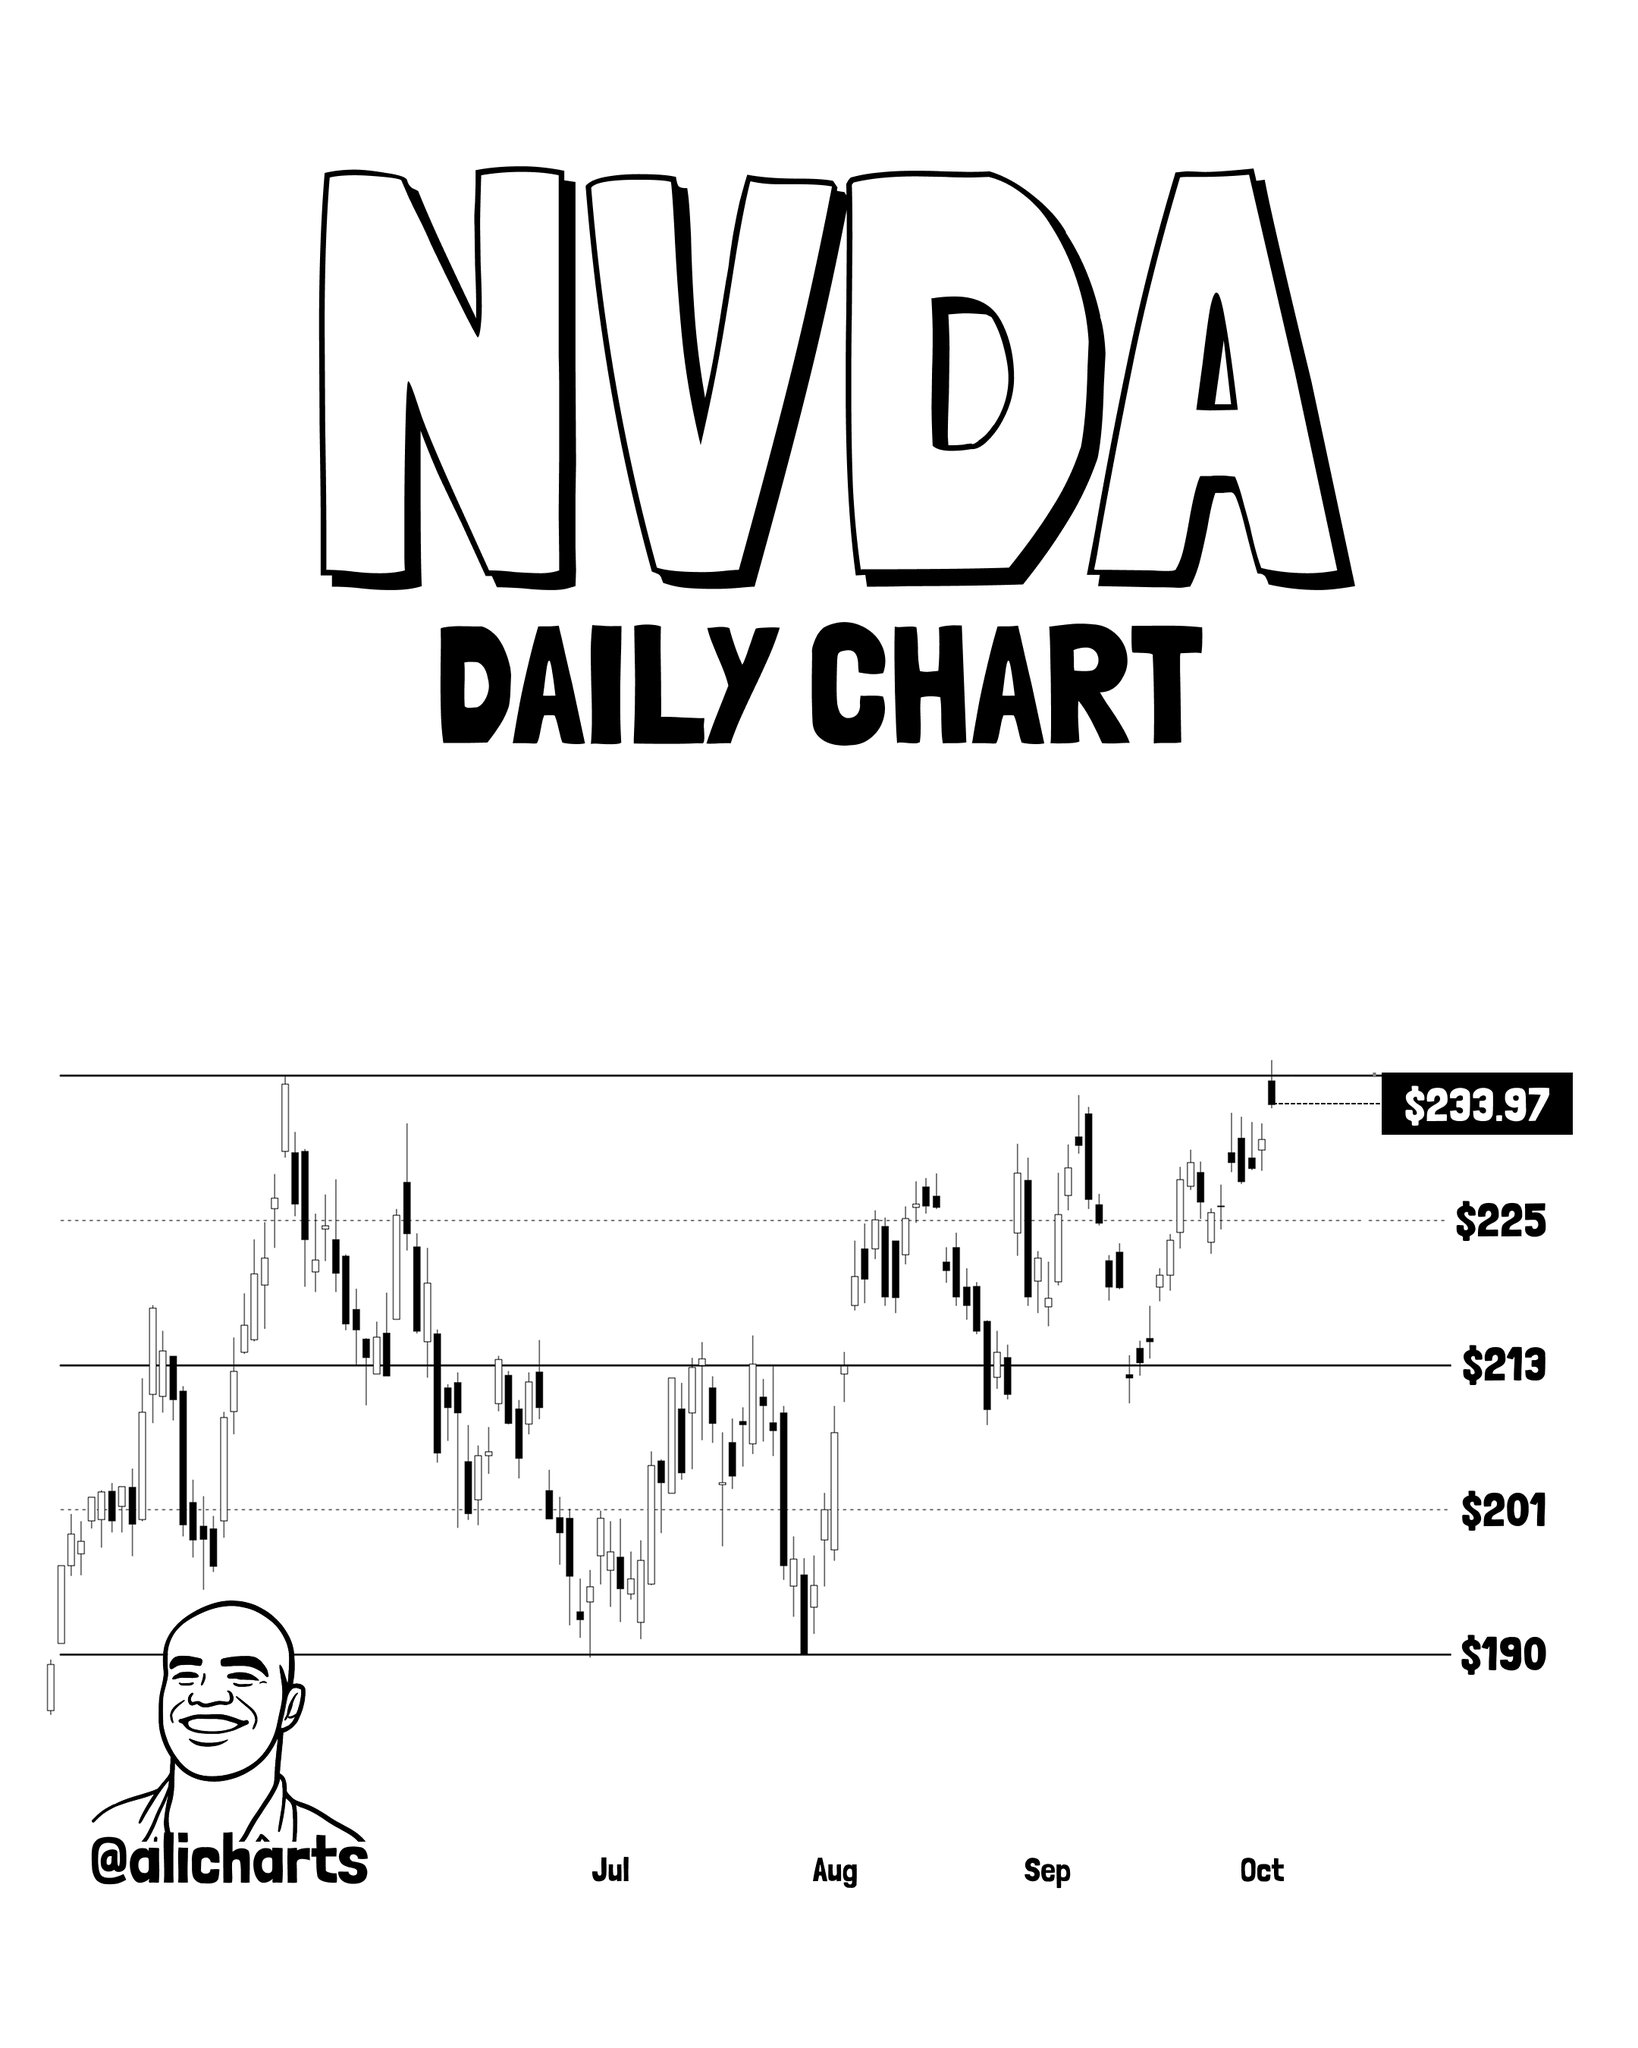
- NVDA surged 13.9% from $208.93 to a record $237.88 since September 14, hitting six-month channel resistance
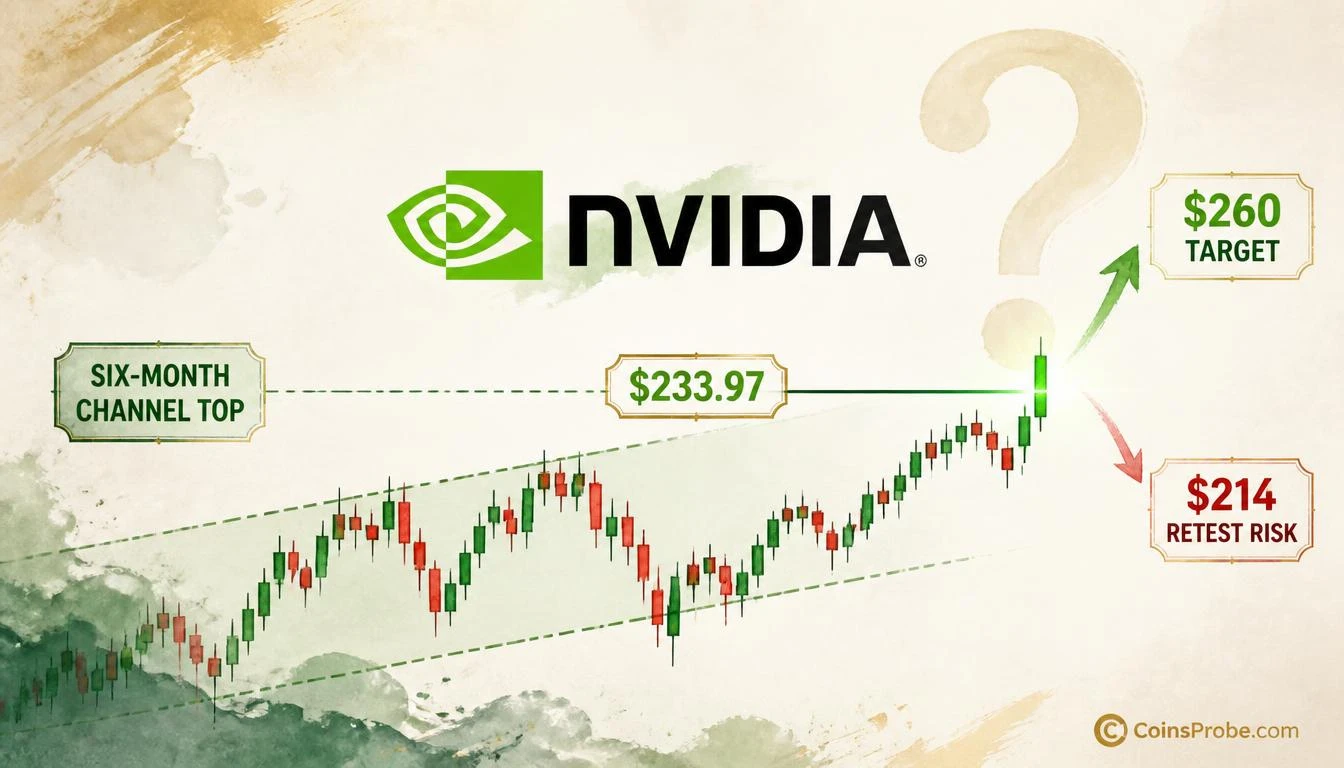
- Ali says the rally is meeting resistance at the top of a six-month channel. $233.97 is the price box on the chart, not a level he named.
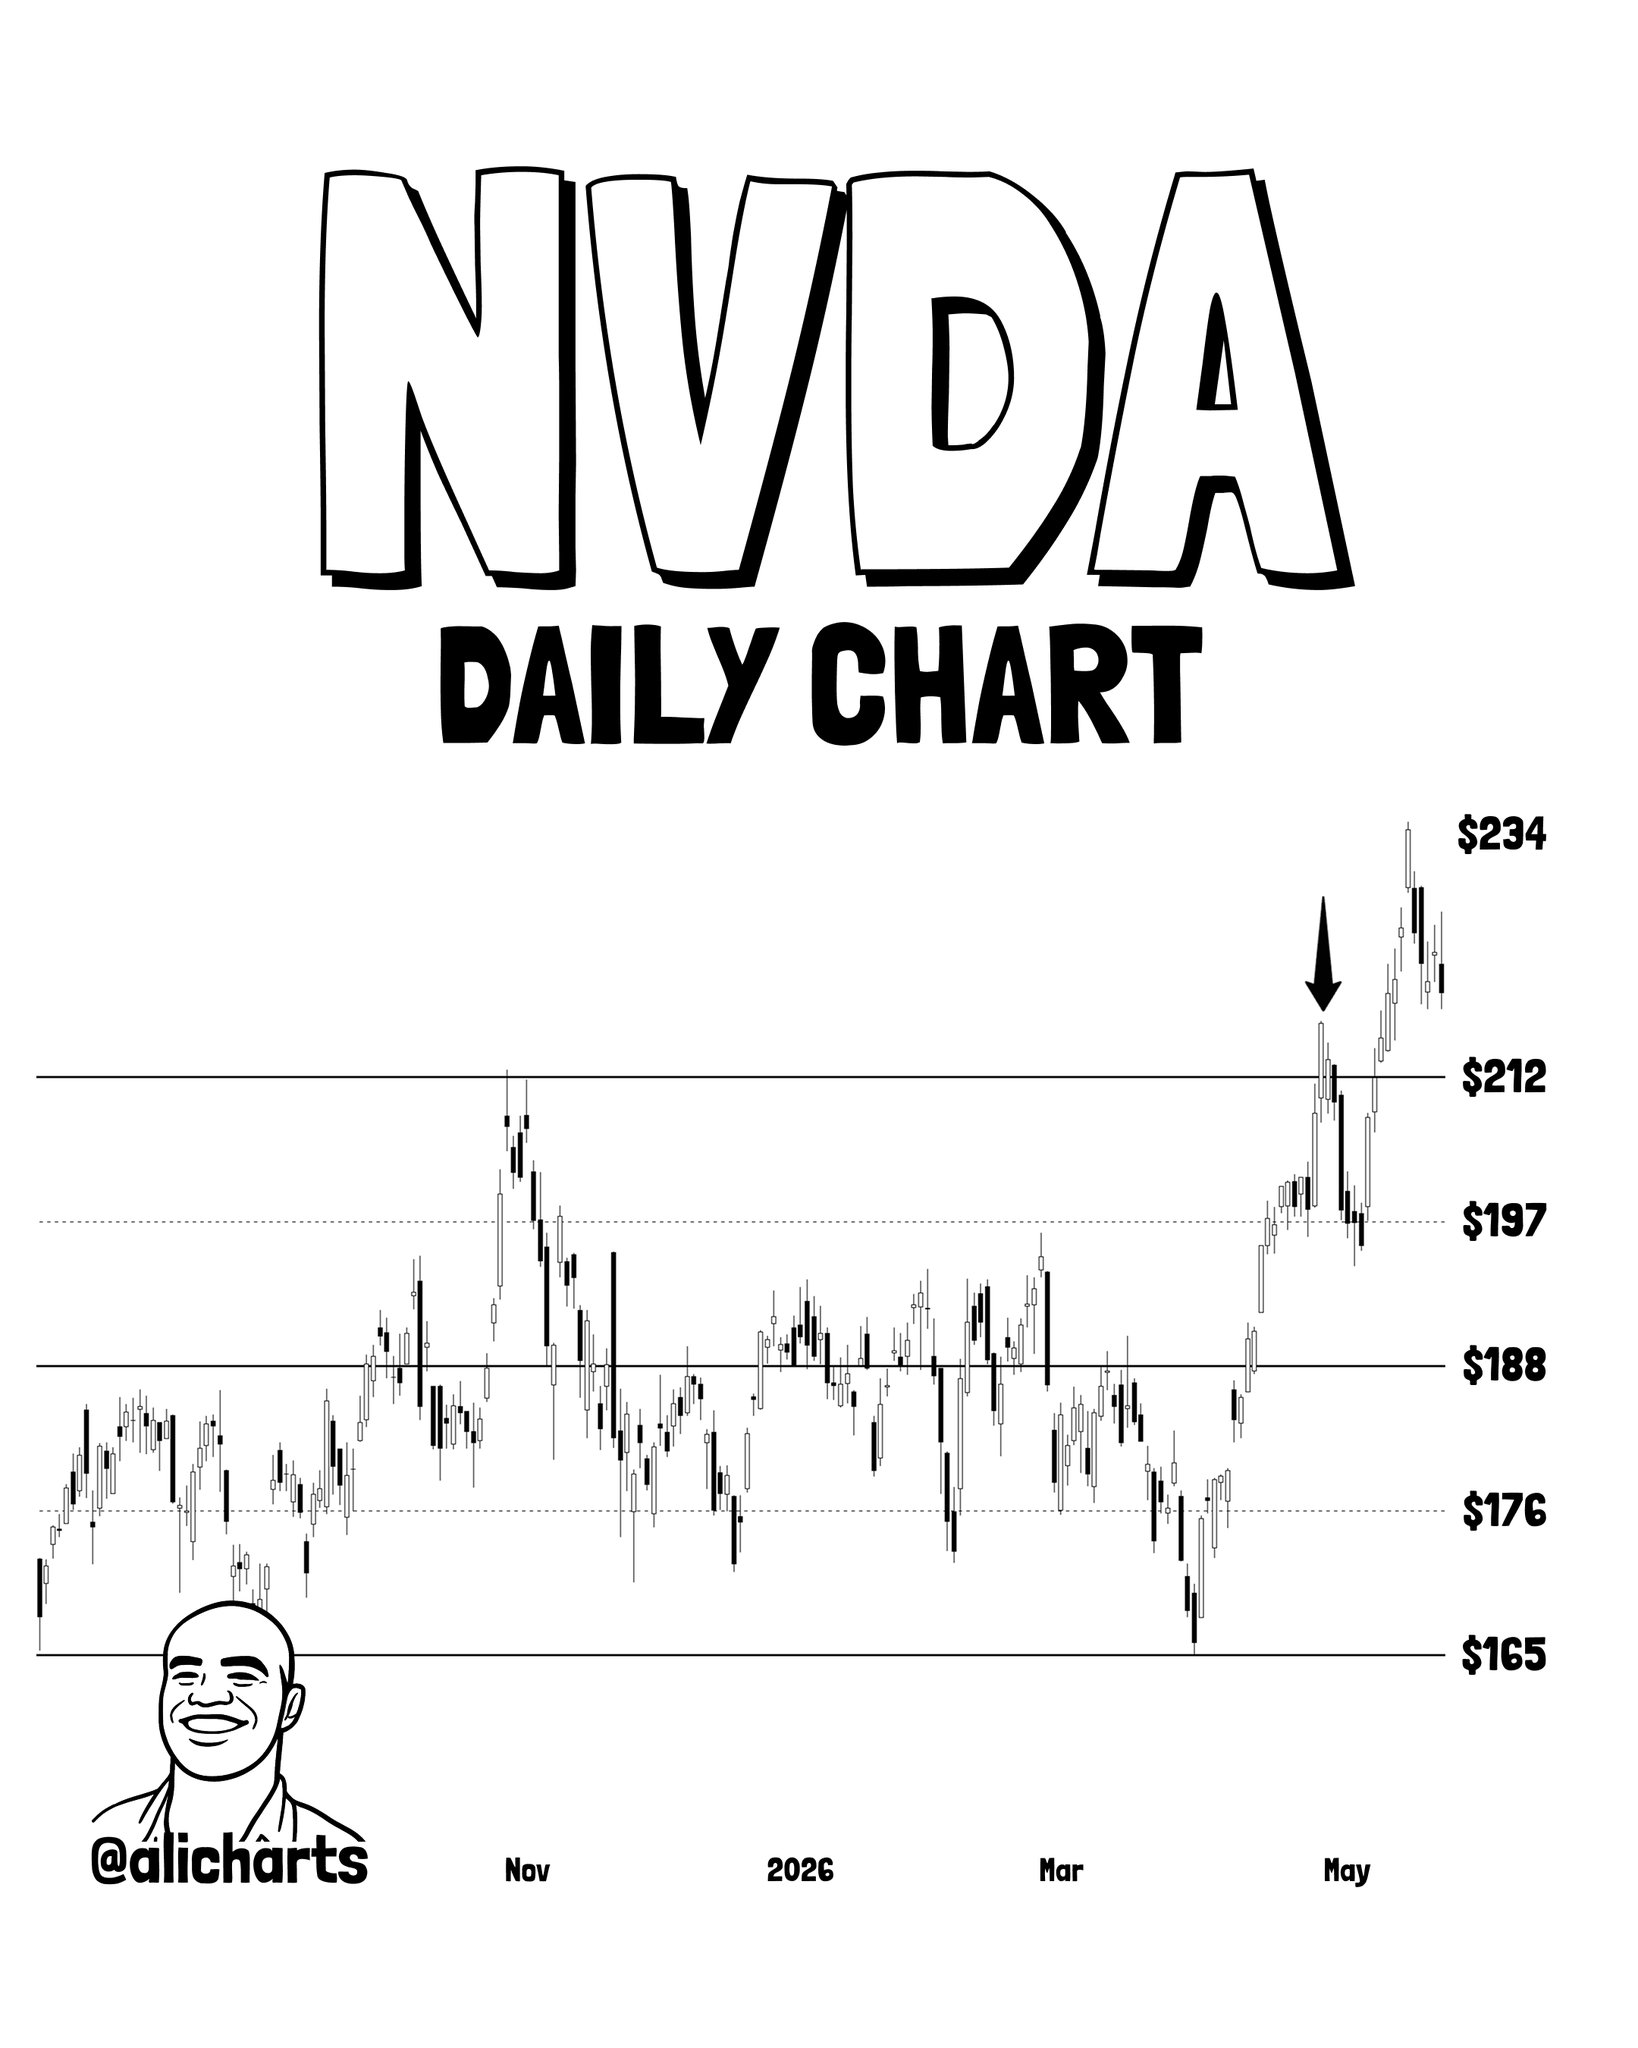
- April precedent: NVDA fell from $216.83 to $194.74 (~10%) before recovering and breaking the channel
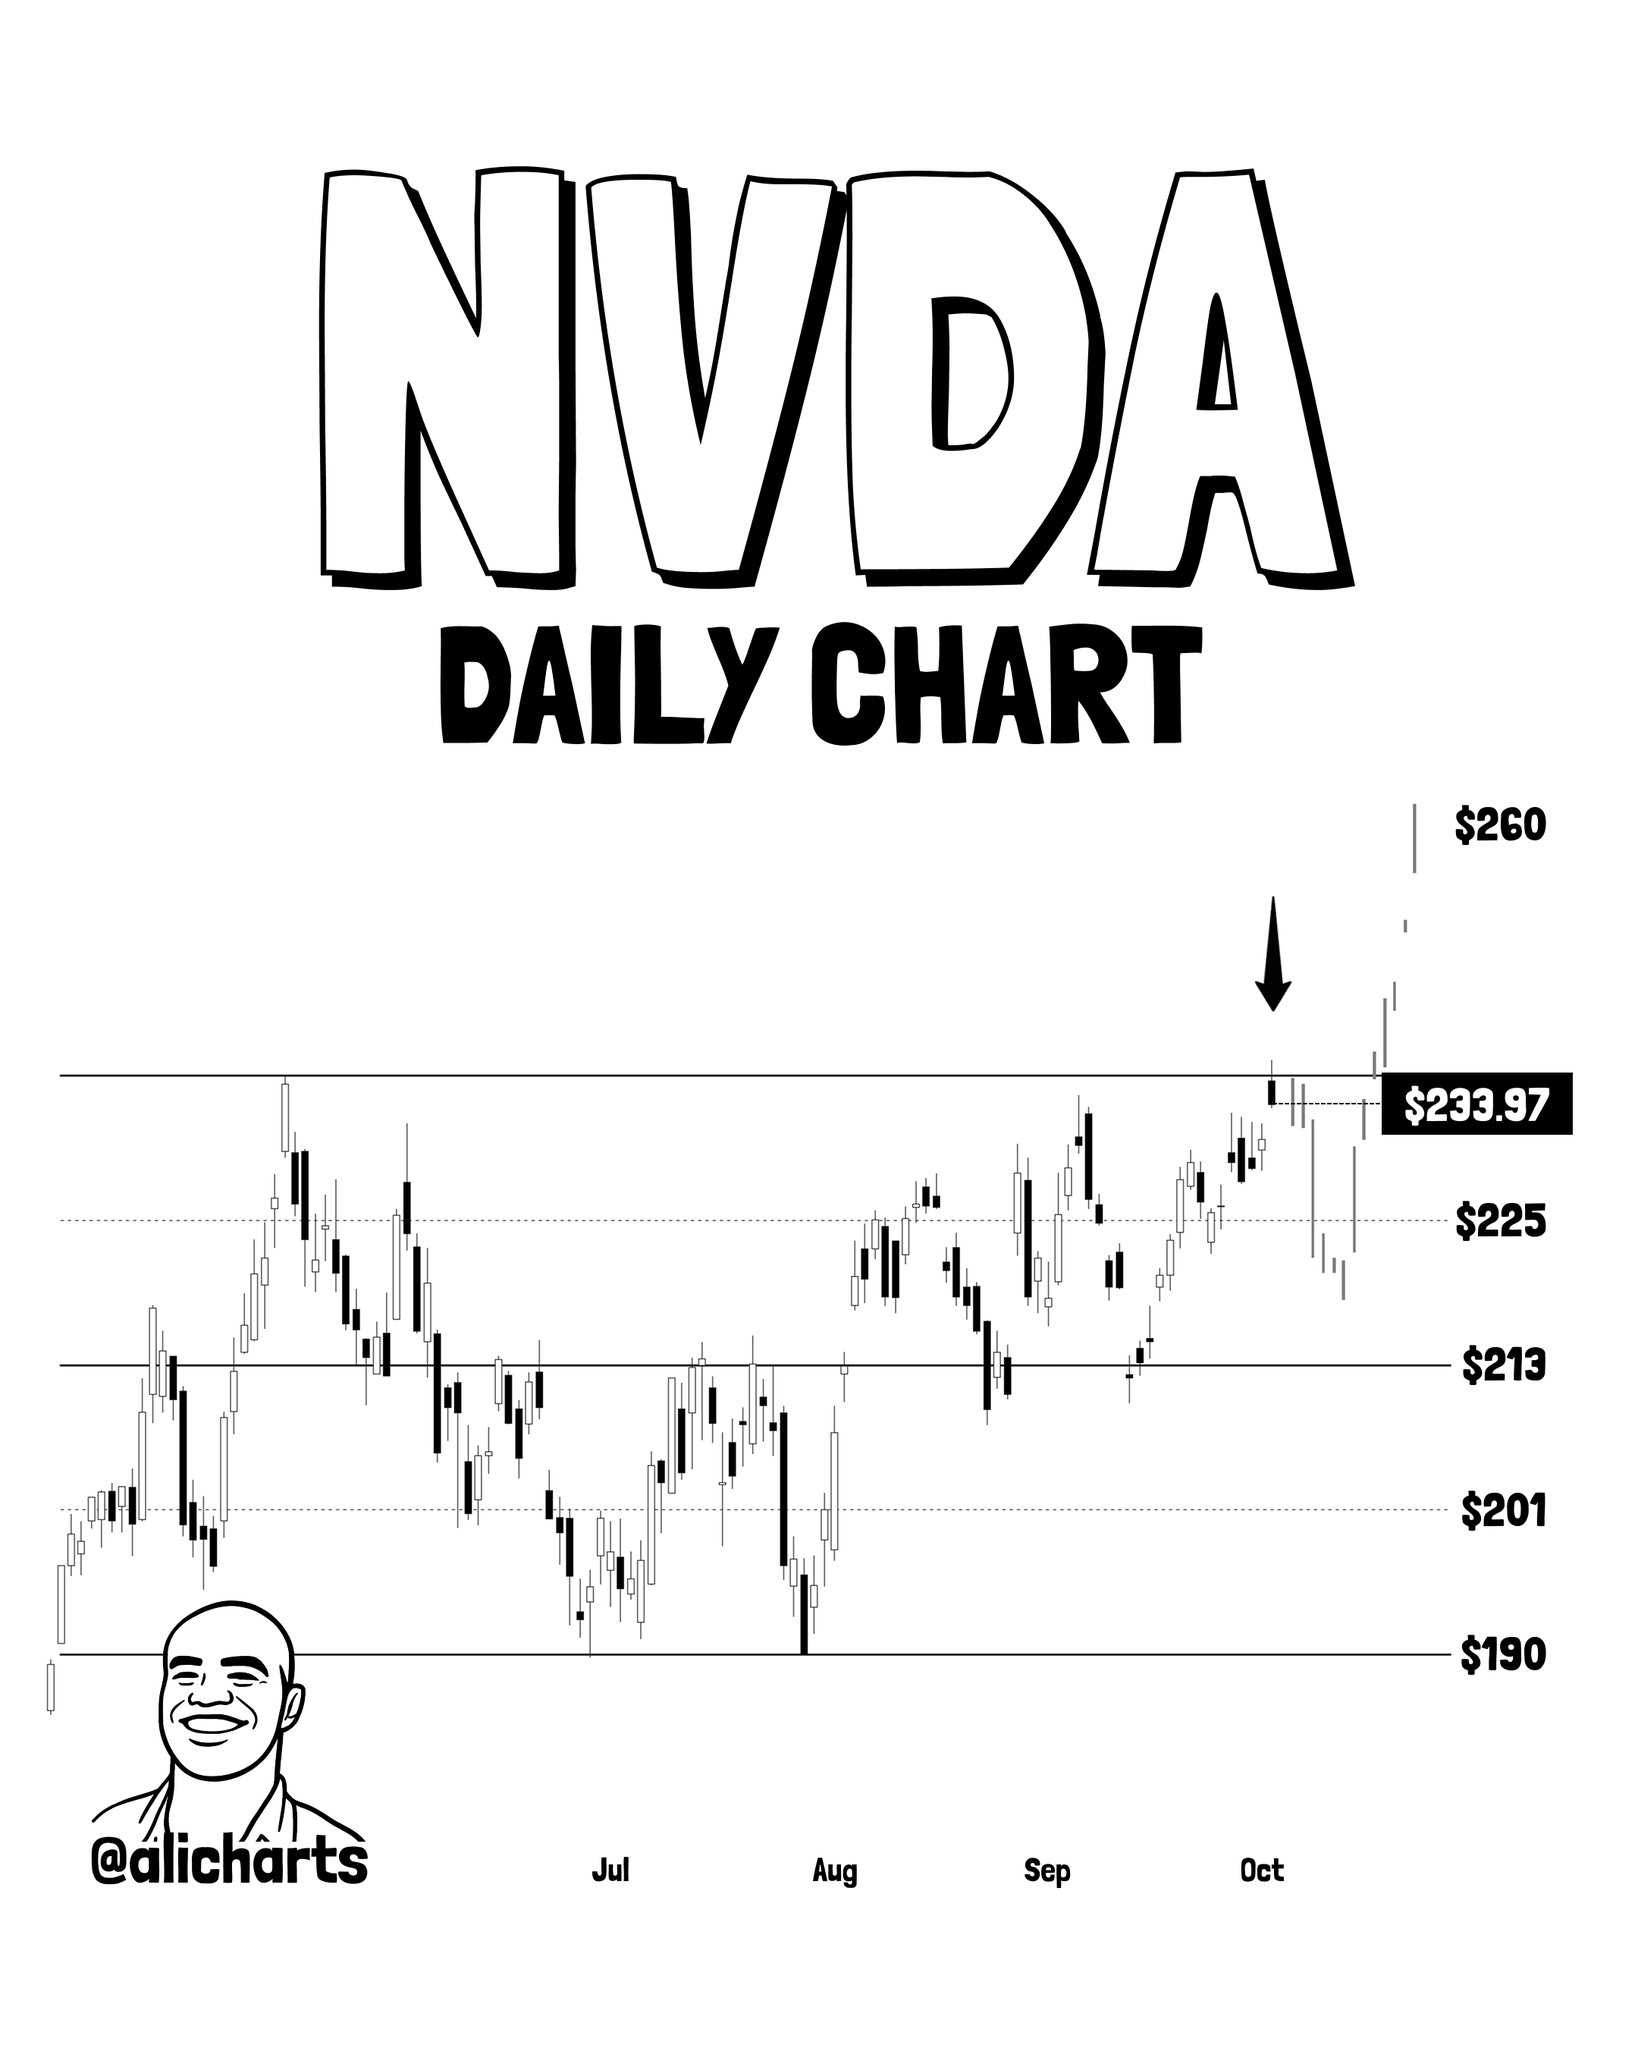
- If the April sequence repeats, he sees a retrace toward $220 first. $260 comes only on a second breakout.
NVIDIA ($NVDA) has printed a new all-time high — but the rally has delivered the stock directly into one of the most contested technical zones on its daily chart. Since September 14, NVDA has surged nearly 14%, climbing from $208.93 to a record $237.88. That move is not in question. What is in question is whether this is a genuine breakout or a fakeout at the top of a six-month horizontal channel.
Analyst Ali Martinez (@alicharts) laid out the case across a five-part thread, saying the rally has reached the top of a six-month channel and is meeting resistance. The $233.97 figure is the price box on the chart, not a level he named. His read: the setup bears a striking resemblance to the late-April sequence — and that precedent did not immediately reward bulls.
The Six-Month Channel — What It Is and Why It Matters Now
A horizontal channel is defined by a price range where the asset repeatedly fails to close above an upper ceiling and holds above a lower floor. NVDA’s daily chart, spanning approximately July through October, shows exactly that structure — with a defined upper resistance ceiling and a lower support floor. The chart prints gridlines at $190, $201, $213, and $225. Ali does not name those as targets. He says price is at the channel top. $233.97 is the current-price box, and the latest candles have spiked above that print.
But a spike and a confirmed breakout are two different events. The chart shows a downward arrow near the current price area, with $260 marked at the top of the chart as a projected upside target. That $260 level is not historical price — it is a forward projection, sitting beyond the current price action on the right edge of the chart.
The April Parallel — A Precedent Worth Taking Seriously
The late-April setup is the critical historical anchor in this analysis. Per @alicharts, NVDA reached a new high near channel resistance at approximately $216.83, then fell roughly 10% to $194.74 before recovering and ultimately breaking above the channel. The November 2025 through May 2026 chart shows this sequence explicitly — a period of sideways consolidation, a breakout attempt near $216.83, a pullback, and then a confirmed move higher with a breakout above the range.
The analyst draws a direct parallel: the downward arrow on the current chart near the $234 area mirrors the exhaustion signal marked at the April peak. After the April pullback, NVDA recovered, broke the channel, and later reached $236.54. Ali’s current path is a retrace toward $220, then a retest of the channel top. He is watching $225–$220 rather than a chase at resistance.
The Two-Step Scenario — Retracement, Then Resolution
The third chart in @alicharts’s thread is the most explicit about the forward projection. It prints $233.97 as the current-price box, with the latest candle spiked above that print. The downward arrow is the retrace he describes toward $220. The downward arrow signals an anticipated near-term pullback from the current price. Above all that sits $260 — marked as a future upside target, the implied destination if NVDA absorbs the resistance and confirms a clean breakout.
The structure the analyst is presenting is a two-step scenario: a retrace toward $220, a retest of the channel top, and $260 only if that second attempt breaks out. It is not a guarantee — it is the reward side of the trade if the breakout is genuine rather than a fakeout.
NVDA’s run to new all-time highs is part of a broader story. The stock recently surpassed a $5.72 trillion market cap, and its AI platform influence has extended well beyond traditional tech — including driving momentum in assets like HBAR. Its concentration within the S&P 500 is now at historically extreme levels, as noted in coverage of NVDA and Apple’s combined 15% S&P 500 weighting surpassing the 1999 dot-com peak.
Bullish Scenario — Second Breakout
Ali’s path is a retrace toward $220, then a retest of the channel top. $260 comes into focus only if that second attempt breaks out. A close above the $233.97 price box is not the trigger he set.
Bearish Scenario — Rejection and the April Repeat
If the April sequence repeats: Ali’s retrace is toward $220, with $225–$220 as the area he is watching. He does not set $214 or $212 as a target. $212 is a gridline on the April chart.
The verdict between fakeout and breakout will not be delivered in a single candle. Ali’s sequence is a retrace toward $220, a retest of the channel top, and $260 only on a second breakout. He is watching $225–$220 rather than a chase at resistance. $233.97 is the price box on the chart, not the ceiling he named.
Frequently Asked Questions
What is the six-month channel resistance level NVDA is testing?
What happened the last time NVDA hit channel resistance in April?
What is the upside target if NVDA confirms a breakout above channel resistance?
What level would signal the April pullback scenario is repeating?
Source: Ali Charts · Published by CoinsProbe Markets Desk
The opinions and market insights shared on CoinsProbe represent the views of individual authors based on prevailing market conditions at the time of publication. Cryptocurrency investments carry significant risk and volatility. Readers are encouraged to conduct their own research and seek professional financial advice before making investment decisions. CoinsProbe and its contributors do not accept responsibility for financial losses or decisions made based on published content.
CoinsProbe may publish sponsored articles, affiliate links, or promotional collaborations. All sponsored material is clearly labeled to maintain transparency with our audience. Our editorial decisions remain fully independent, and advertising partnerships do not influence reviews, rankings, or published opinions.
Since 2023, CoinsProbe has delivered reliable insights on cryptocurrency, blockchain, and digital assets. Our content is created by experienced researchers and analysts who follow strict editorial standards focused on accuracy, transparency, and credibility. Every article is carefully reviewed and verified using trusted sources and current market data. We provide unbiased analysis and timely updates covering everything from emerging crypto projects to major industry developments.