Date: Sun, February 16, 2025 | 02:52 AM GMT
In the cryptocurrency market this week, major altcoins are showing signs of recovery after weeks of correction, as Bitcoin dominance has dropped by 1.11% over the past seven days.
Following this, Litecoin (LTC) is gaining strong momentum, surging 28% in the past week, fueled by growing speculation about a potential spot ETF approval.

This surge has brought LTC to a critical technical level, where traders are closely watching for a breakout.
Litecoin (LTC) Price Analysis
On the daily chart, Litecoin has shown a strong recovery from $80, which followed market-wide sell-offs triggered by concerns over tariffs announced by former U.S. President Donald Trump on February 3. However, supported by the 200-day and 100-day moving averages (MAs), LTC has rebounded sharply and is now trading around $135.
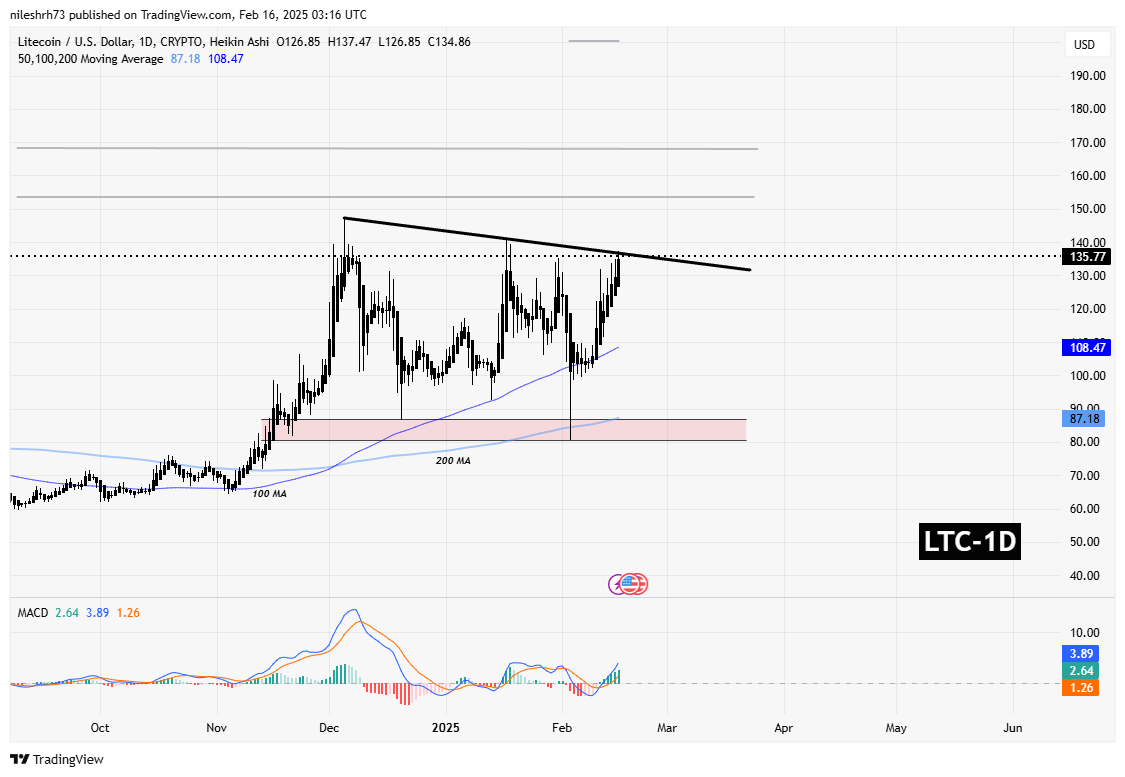
LTC is currently testing the descending trendline resistance of a long-term descending triangle formation. This level, near $135-$140, has been a critical supply zone for sellers in previous attempts.
If Litecoin breaks above this resistance with strong volume and a successful retest, the next major resistance levels to watch are:
- $147 – The first key level confirming an uptrend.
- $157 – $168 – Potential targets, representing a 24% rally from current levels.
The MACD (Moving Average Convergence Divergence) indicator is currently turning bullish, as the blue MACD line is crossing above the orange signal line, indicating a shift in momentum towards buyers. If this continues, it will add confidence to a potential breakout.
What If Litecoin Fails to Break Resistance?
On the downside, if LTC faces rejection at the resistance level, it could see a pullback toward the 100-day moving average for a retest of support.
Disclaimer: This article is for informational purposes only and should not be considered financial advice. Always do your research before making investment decisions.
The opinions and market insights shared on CoinsProbe represent the views of individual authors based on prevailing market conditions at the time of publication. Cryptocurrency investments carry significant risk and volatility. Readers are encouraged to conduct their own research and seek professional financial advice before making investment decisions. CoinsProbe and its contributors do not accept responsibility for financial losses or decisions made based on published content.
CoinsProbe may publish sponsored articles, affiliate links, or promotional collaborations. All sponsored material is clearly labeled to maintain transparency with our audience. Our editorial decisions remain fully independent, and advertising partnerships do not influence reviews, rankings, or published opinions.
Since 2023, CoinsProbe has delivered reliable insights on cryptocurrency, blockchain, and digital assets. Our content is created by experienced researchers and analysts who follow strict editorial standards focused on accuracy, transparency, and credibility. Every article is carefully reviewed and verified using trusted sources and current market data. We provide unbiased analysis and timely updates covering everything from emerging crypto projects to major industry developments.