Date: Tuesday, February 18, 2025 | 07:06 AM GMT
In the cryptocurrency market today, major altcoins are facing sharp declines, especially within the Solana ecosystem, as the price of Solana (SOL) itself is down by 7% in the last 24 hours. The rise in Bitcoin dominance, which surged over 1% within the past 24 hours, has added significant bearish pressure on altcoins.
Amid this, two Solana ecosystem tokens, Jupiter (JUP) and Raydium (RAY), have taken a sharp hit. JUP declined by 9%, while RAY dropped over 5%, adding to their monthly corrections, averaging over 35%.

Jupiter (JUP) Analysis
The weekly JUP chart shows that the price has been trading within a year-long descending triangle pattern. The recent downtrend, which began in early December after a rejection from $1.44, has pushed JUP into deeper correction territory.

As of now, JUP has hit the crucial support zone of $0.63 to $0.73, which is marked as a red support zone on the chart. This level has previously acted as a strong rebound area, and if JUP manages to hold above it, a recovery could be possible in the coming weeks. A bounce from this level could lead to a retest of the descending triangle’s upper resistance trendline near $1.20 – $1.40.
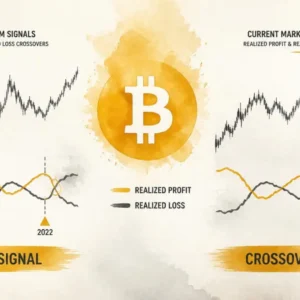
- The MACD indicator is showing bearish momentum, with red histogram bars increasing, indicating selling pressure is still active.
- However, a bullish crossover on the MACD could signal the start of a reversal.

Raydium (RAY) Analysis
On the other hand, Raydium (RAY) is consolidating within an ascending broadening wedge pattern, which is a bearish formation in technical analysis.
The recent downtrend, which began on January 23 after a rejection from $8.67, has pushed RAY to test its lower trendline support around $4.31. Currently, RAY is holding just above this level at $4.46, indicating some buying interest.

While ascending broadening wedges tend to break downward eventually, there is still room for RAY to make a higher high from this support level before any breakdown occurs. If RAY bounces from this level, it could move toward the next resistance levels at $5.80 and $7.40.
- The MACD is showing bearish momentum, with the MACD line crossing below the signal line, confirming short-term selling pressure.
- If bulls step in, a potential bullish divergence could form, signaling a possible trend reversal.
Final Thoughts
Both JUP and RAY are sitting at crucial support levels. If these levels hold, we could see a short-term relief rally. However, if these supports break, further downside movement could be expected.
Traders should monitor volume, MACD crossovers, and Bitcoin dominance before making any trading decisions.

Disclaimer: This article is for informational purposes only and not financial advice. Always conduct your own research before investing in cryptocurrencies.
The opinions and market insights shared on CoinsProbe represent the views of individual authors based on prevailing market conditions at the time of publication. Cryptocurrency investments carry significant risk and volatility. Readers are encouraged to conduct their own research and seek professional financial advice before making investment decisions. CoinsProbe and its contributors do not accept responsibility for financial losses or decisions made based on published content.
CoinsProbe may publish sponsored articles, affiliate links, or promotional collaborations. All sponsored material is clearly labeled to maintain transparency with our audience. Our editorial decisions remain fully independent, and advertising partnerships do not influence reviews, rankings, or published opinions.
Since 2023, CoinsProbe has delivered reliable insights on cryptocurrency, blockchain, and digital assets. Our content is created by experienced researchers and analysts who follow strict editorial standards focused on accuracy, transparency, and credibility. Every article is carefully reviewed and verified using trusted sources and current market data. We provide unbiased analysis and timely updates covering everything from emerging crypto projects to major industry developments.