Date: Fri, March 28, 2025 | 08:20 AM GMT
The cryptocurrency market has once again turned bearish after a brief green week. Ethereum (ETH) has declined by over 5% in the last 24 hours, adding downward pressure on altcoins like XRP and Kaspa (KAS).
Meanwhile, Kaspa (KAS) has already suffered a 38% drop over the last 90 days after breaking down from a key bearish pattern. Now, XRP appears to be mirroring KAS’s price action, suggesting a potential downside move.

KAS and XRP Chart Comparison
The left-side chart shows Kaspa (KAS) in a clear downtrend after breaking down from a bearish head and shoulders pattern. This breakdown, combined with the loss of the 50-day and 100-day moving averages (MAs), sent KAS tumbling towards its support zone at $0.054 before making a minor recovery to $0.072.
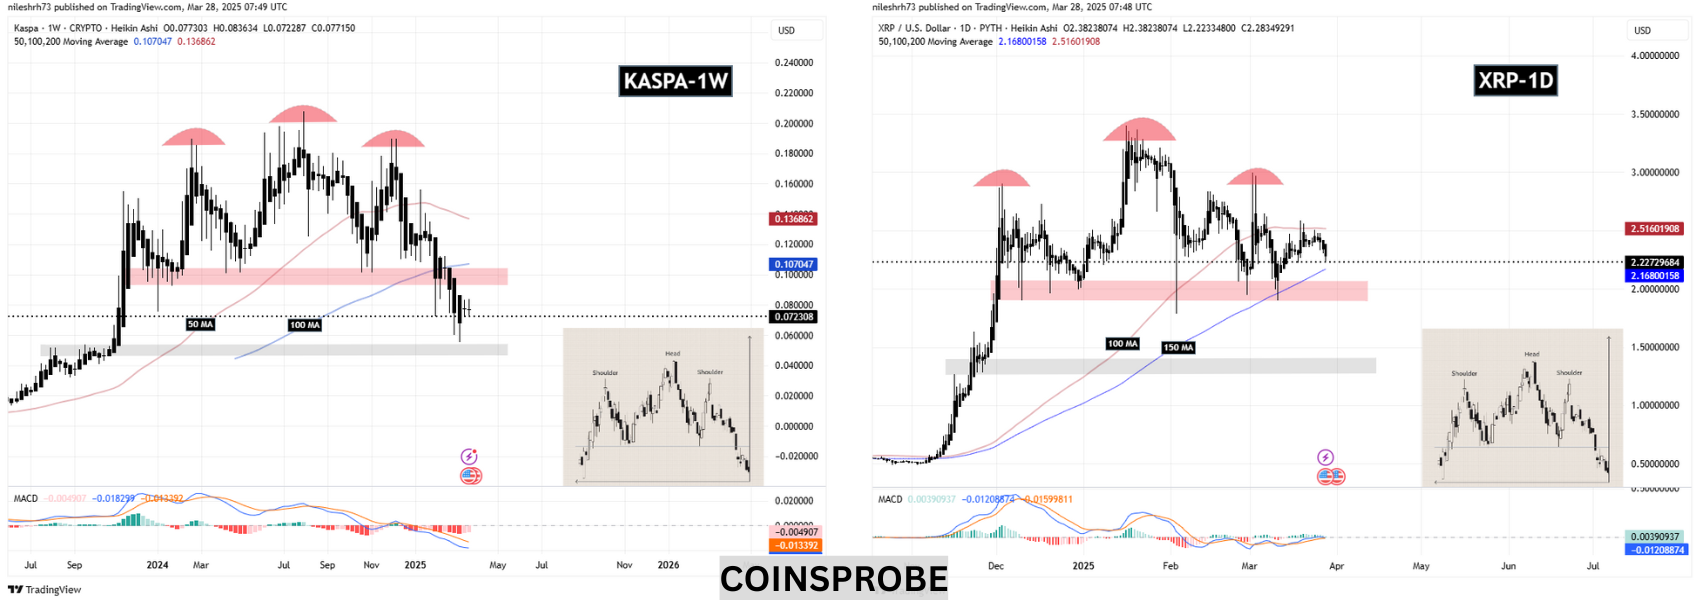
Meanwhile, the right-side chart of XRP exhibits striking similarities to KAS. XRP has also formed a head and shoulders pattern and recently lost support at the 50-day MA. The price is currently trending downward, approaching its crucial 150-day MA support (marked in the chart).
This 150 MA level could act as a turning point—if XRP bounces off this level, the breakdown scenario might be invalidated. However, if XRP fails to hold this support, the next major support zone sits at $1.97, where a final decision will be made on whether XRP will break down further like Kaspa.
Final Thoughts
Both Kaspa and XRP have followed similar bearish structures, with KAS already breaking down, while XRP is still at a critical decision point. If XRP holds the 150-day MA, it may avoid a steep decline, but if it loses this support, further downside could be on the horizon.

Disclaimer: This article is for informational purposes only and does not constitute financial advice. Always conduct your own research before investing in cryptocurrencies.

The opinions and market insights shared on CoinsProbe represent the views of individual authors based on prevailing market conditions at the time of publication. Cryptocurrency investments carry significant risk and volatility. Readers are encouraged to conduct their own research and seek professional financial advice before making investment decisions. CoinsProbe and its contributors do not accept responsibility for financial losses or decisions made based on published content.
CoinsProbe may publish sponsored articles, affiliate links, or promotional collaborations. All sponsored material is clearly labeled to maintain transparency with our audience. Our editorial decisions remain fully independent, and advertising partnerships do not influence reviews, rankings, or published opinions.
Since 2023, CoinsProbe has delivered reliable insights on cryptocurrency, blockchain, and digital assets. Our content is created by experienced researchers and analysts who follow strict editorial standards focused on accuracy, transparency, and credibility. Every article is carefully reviewed and verified using trusted sources and current market data. We provide unbiased analysis and timely updates covering everything from emerging crypto projects to major industry developments.