
Date: Mon, March 31, 2025 | 09:56 AM GMT
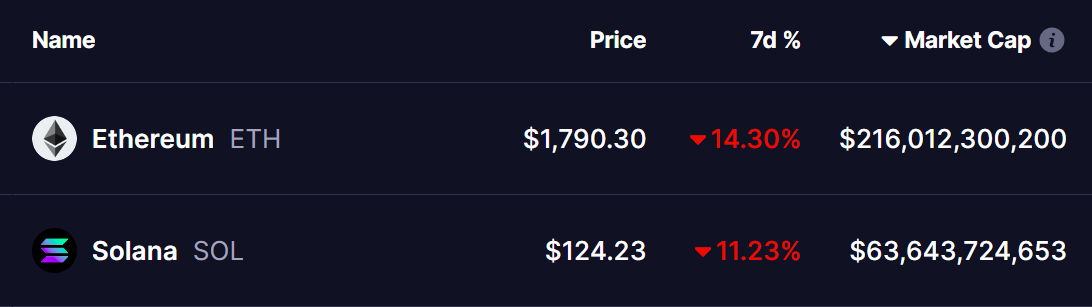
The cryptocurrency market is facing bearish pressure as Ethereum (ETH) has dropped by over 14% over the past week. The downward momentum is partly influenced by escalating global trade tensions, with Donald Trump set to impose reciprocal tariffs on all countries on April 2.
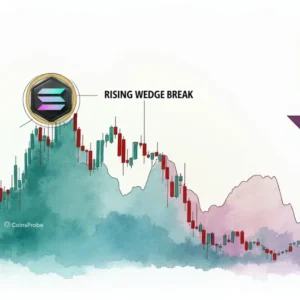
Following this, top altcoin Solana (SOL) has also taken significant hits, falling 11%. However, the current fractal chart suggests that SOL might be on the verge of another rally, mirroring a similar pattern previously seen in Cardano (ADA).
ADA-Based Fractal Hints at Bullish Move
Historical price action often provides valuable insights into future trends. A strong case for a bullish reversal in Solana can be found by looking at Cardano’s (ADA) consolidation phase back in May 2021. During that period, ADA underwent a steep correction following a parabolic rise, losing nearly 60% its value before finding stability around a key support level. This consolidation formed a base above the 150-day moving average, where accumulation occurred before ADA launched into another major rally.
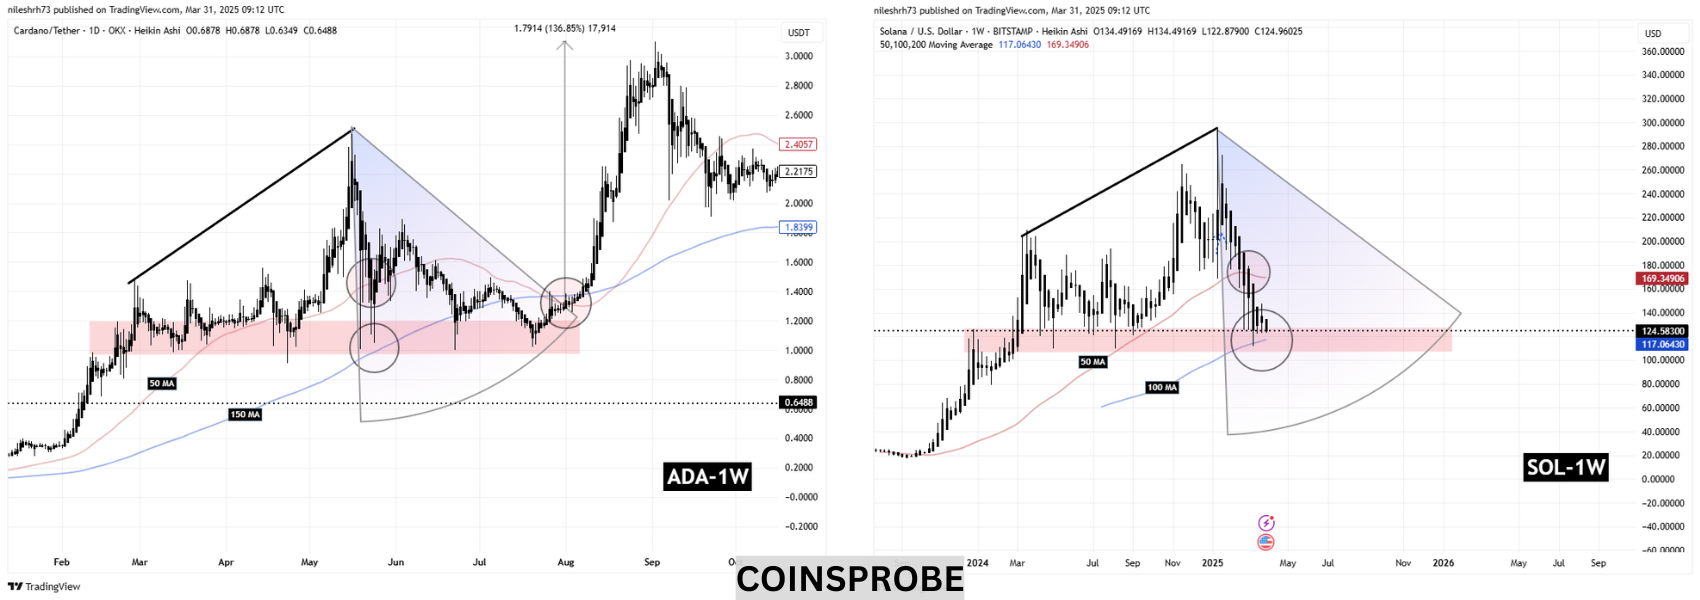
A similar setup is now visible in Solana’s price chart. After a major run-up, SOL experienced a sharp decline of same 60%, breaking below its ascending wedge and retracing to a significant support region. Just like ADA in 2021, SOL has now settled around a key accumulation zone, coinciding with the 100-day moving average. Both assets faced resistance at their respective 50-day moving averages during the recovery phase, indicating a period of consolidation before an impulsive move.
If Solana continues to mirror Cardano’s historical pattern, it could be gearing up for a strong bullish breakout in the coming months. Back in 2021, ADA surged over 136% following its consolidation, breaking through resistance levels and entering price discovery mode. If SOL follows the same trajectory, a move toward the $300-$330 range is not out of the question once accumulation is complete and key resistance levels are breached.
Market participants should pay close attention to whether SOL can hold its support range between $107-$127, as this is a critical zone where demand needs to step in. The similarities between the two charts suggest that history might be repeating itself, and those watching Solana’s price action closely could be in for an exciting few months ahead.
Final Thoughts
While current market conditions remain volatile, Solana’s price action aligns with a historical fractal that previously led to a strong bullish move in Cardano. The similarities in price structure, moving average interactions, and accumulation behavior indicate that a potential breakout may be on the horizon. If SOL continues to respect its historical support levels and experiences a similar breakout, investors could see significant upside potential in the coming months.
However, market conditions and macroeconomic factors can always influence price movements. As always, investors should conduct their own research and manage risk appropriately.

Disclaimer: This article is for informational purposes only and not financial advice. Always conduct your own research before investing in cryptocurrencies.

The opinions and market insights shared on CoinsProbe represent the views of individual authors based on prevailing market conditions at the time of publication. Cryptocurrency investments carry significant risk and volatility. Readers are encouraged to conduct their own research and seek professional financial advice before making investment decisions. CoinsProbe and its contributors do not accept responsibility for financial losses or decisions made based on published content.
CoinsProbe may publish sponsored articles, affiliate links, or promotional collaborations. All sponsored material is clearly labeled to maintain transparency with our audience. Our editorial decisions remain fully independent, and advertising partnerships do not influence reviews, rankings, or published opinions.
Since 2023, CoinsProbe has delivered reliable insights on cryptocurrency, blockchain, and digital assets. Our content is created by experienced researchers and analysts who follow strict editorial standards focused on accuracy, transparency, and credibility. Every article is carefully reviewed and verified using trusted sources and current market data. We provide unbiased analysis and timely updates covering everything from emerging crypto projects to major industry developments.