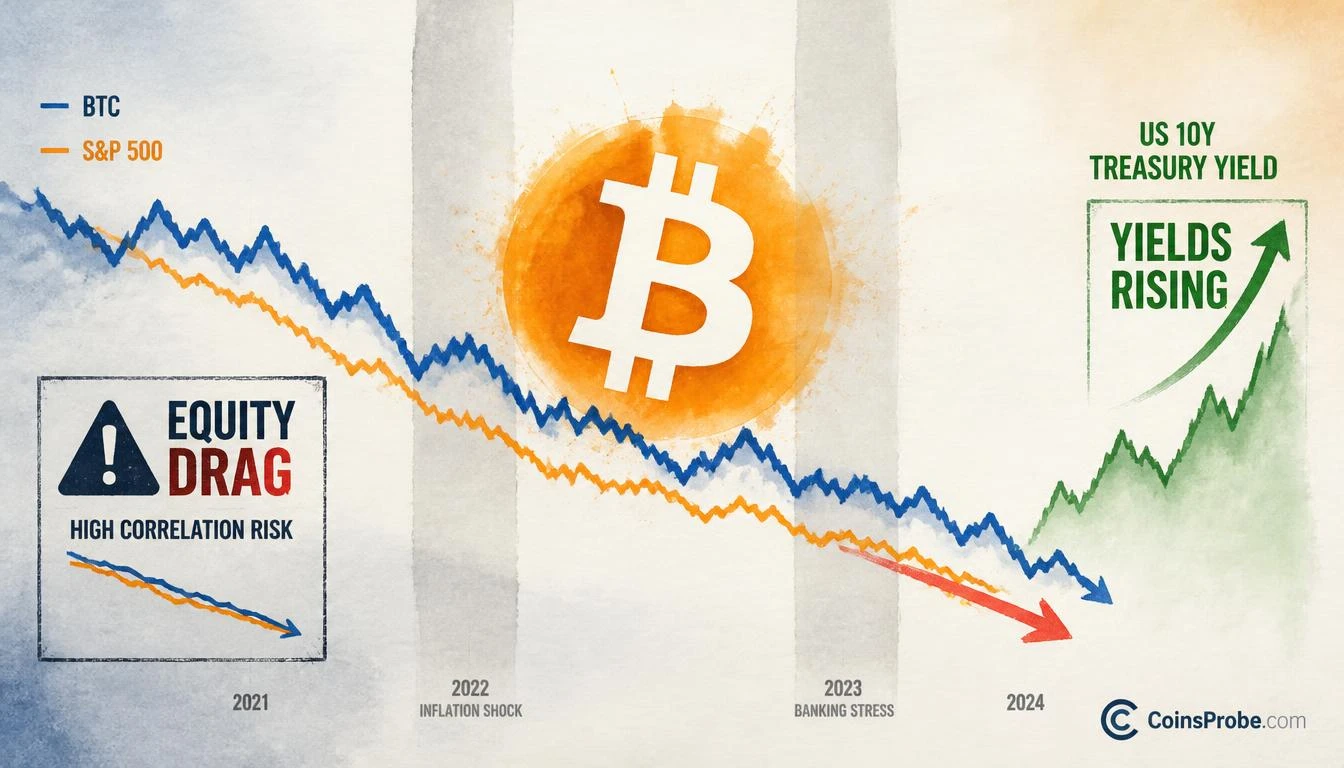
- Bitcoin trades at $83,106 (+2.00% 24h) as CryptoQuant analyst @nocoffeenobrain flags rising equity correlation risk
- Analyst warns: "If equities take a bigger hit from here, BTC could be dragged lower with them"
- Chart shows BTC and S&P 500 moving in tandem during both 2018–2019 and 2025 stress periods
- 10-Year Treasury yields elevated and rising again — same macro backdrop as prior BTC stress zones
Bitcoin is trading at approximately $83,106 — up 2.00% in the past 24 hours — with a market capitalization of $1.67 trillion. But beneath the modest intraday recovery, a CryptoQuant analyst is flagging a structural risk that has historically overridden short-term momentum: Bitcoin’s correlation to equity markets is rising again, and if stocks take a deeper hit, BTC may not be able to decouple.
The warning comes from CryptoQuant analyst @nocoffeenobrain, published via the @cryptoquant_com account on October 21, 2026. The analyst’s conclusion is direct: “If equities take a bigger hit from here, BTC could be dragged lower with them.” That single sentence encapsulates the core risk — not a breakdown in Bitcoin’s own fundamentals, but a contagion scenario driven by macro-level equity selling pressure.
The Chart — Correlation Risk Across Three Assets
The chart shared by @cryptoquant_com plots Bitcoin (blue), the S&P 500 (orange), and US 10-Year Treasury Yields (green) across a timeframe spanning approximately 2018 through 2026. Two shaded vertical bands mark notable stress periods — one around 2018–2019, and a second covering approximately 2025 and continuing into the current period. During both shaded zones, Bitcoin and equities moved lower in tandem. The current shaded zone shows BTC declining from its recent peak while the S&P 500 also softens. Treasury yields, meanwhile, are elevated and rising again — a backdrop that has historically pressured risk assets across the board.
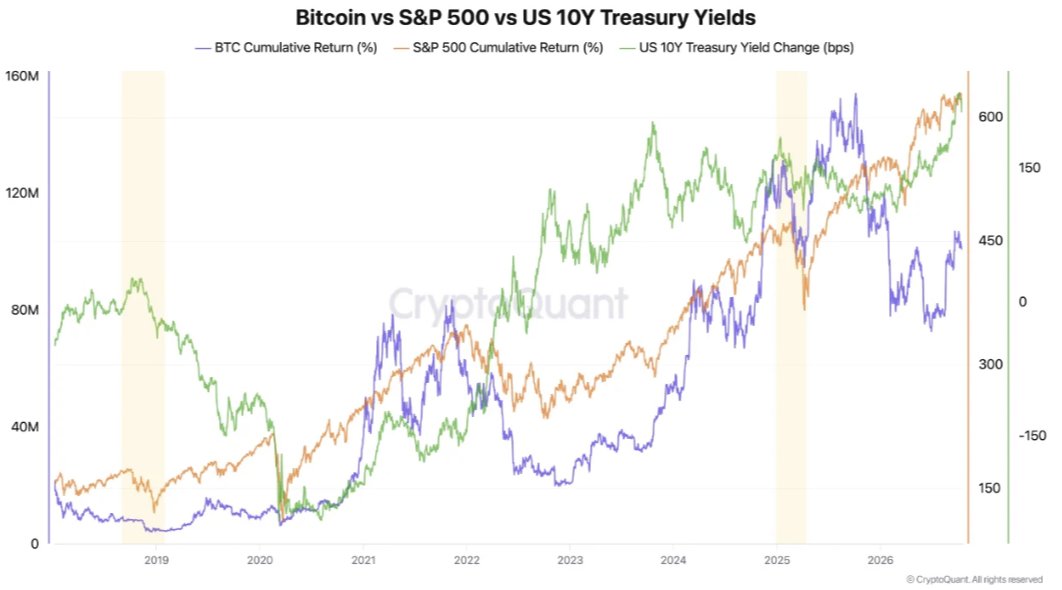
The pattern is not subtle. During the 2018–2019 stress period, BTC experienced one of its most severe drawdowns of the cycle while equities also corrected sharply. The analyst’s visual argument is that the current macro setup — elevated yields, softening equities, and BTC pulling back simultaneously — rhymes closely with that prior stress zone. The implication is that Bitcoin has not yet demonstrated the independent recovery dynamics that would allow it to decouple from a broader equity selloff.
Why Equity Correlation Matters for BTC Right Now
The correlation between Bitcoin and traditional risk assets is not constant. During periods of macro stress — rising yields, tightening financial conditions, or equity market dislocations — institutional participants who hold BTC alongside equities in multi-asset portfolios tend to reduce risk across the board simultaneously. This is not a behavioral quirk; it is a portfolio construction reality. When margin calls or drawdown limits are triggered in equity books, liquid assets including BTC are among the first to be sold.
What makes the current setup notable is the combination of signals the chart presents: equities are softening, yields are rising again after a prior spike, and BTC has already begun declining from its recent peak. All three conditions existed during the 2025 shaded stress period marked on the chart. The analyst’s warning is not that a correction is certain — it is that the preconditions for one are in place if equity selling accelerates.
This is not the first time CryptoQuant has flagged Bitcoin’s macro dependency. As covered previously on CoinsProbe, USDT supply contraction has already been presenting a liquidity headwind for Bitcoin’s recovery. A simultaneous equity-driven selloff would compound that pressure. Separately, CryptoQuant’s own data has shown that while Bitcoin may be building a base, spot demand remains structurally weak — meaning BTC lacks the organic buy-side depth to absorb a macro shock independently.
What Would Change the Outlook
The analyst’s thesis is explicitly conditional: “If equities take a bigger hit from here.” This is not a declaration that a crash is imminent. It is a risk map. If the S&P 500 stabilizes or rebounds, the correlation drag scenario loses its primary engine. Conversely, if equity markets extend their current softness — particularly under the weight of elevated 10-year yields — BTC’s correlation to that move would likely reassert.
The metric to monitor is straightforward: S&P 500 direction and 10-year Treasury yield trajectory. If yields remain elevated or continue rising while equities sell off, @nocoffeenobrain’s scenario becomes the base case. If yields stabilize and risk appetite returns to equities, Bitcoin has room to reassert independent price discovery.
On the on-chain side, large movements in leveraged positions across crypto markets add another variable. As seen recently, high-leverage positioning across crypto markets has been building — a dynamic that could amplify any equity-driven selloff in BTC through cascading liquidations.
Bullish Scenario
If the S&P 500 stabilizes and 10-year Treasury yields pull back from current elevated levels, the equity correlation drag dissipates. Bitcoin would then need to demonstrate independent spot demand recovery — confirmed by rising organic buy volume — to build a case for a sustained move higher from the $83,106 level.
Bearish Scenario
If equities extend their current softness under pressure from rising yields, @nocoffeenobrain’s scenario activates directly. The correlation behavior documented in both the 2018–2019 and 2025 shaded periods on the chart suggests BTC would move lower alongside equities — with the magnitude of the correction tied to the depth of the equity selloff rather than any Bitcoin-specific catalyst.
The analyst’s case rests on one conditional: equity weakness is the trigger, not a Bitcoin-specific breakdown. At $83,106, Bitcoin sits in a position where its next significant move may be determined not by on-chain data or crypto-native catalysts, but by what happens in traditional markets first. Watch the S&P 500 — its direction is the primary variable the analyst has identified as the trigger for BTC’s next leg.
Frequently Asked Questions
Why would Bitcoin fall if the stock market drops?
What specific condition would trigger the correction @nocoffeenobrain is warning about?
Does this warning mean Bitcoin’s fundamentals are broken?
What metric should traders watch to track this risk in real time?
Source: CryptoQuant · Published by CoinsProbe Markets Desk
The opinions and market insights shared on CoinsProbe represent the views of individual authors based on prevailing market conditions at the time of publication. Cryptocurrency investments carry significant risk and volatility. Readers are encouraged to conduct their own research and seek professional financial advice before making investment decisions. CoinsProbe and its contributors do not accept responsibility for financial losses or decisions made based on published content.
CoinsProbe may publish sponsored articles, affiliate links, or promotional collaborations. All sponsored material is clearly labeled to maintain transparency with our audience. Our editorial decisions remain fully independent, and advertising partnerships do not influence reviews, rankings, or published opinions.
Since 2023, CoinsProbe has delivered reliable insights on cryptocurrency, blockchain, and digital assets. Our content is created by experienced researchers and analysts who follow strict editorial standards focused on accuracy, transparency, and credibility. Every article is carefully reviewed and verified using trusted sources and current market data. We provide unbiased analysis and timely updates covering everything from emerging crypto projects to major industry developments.