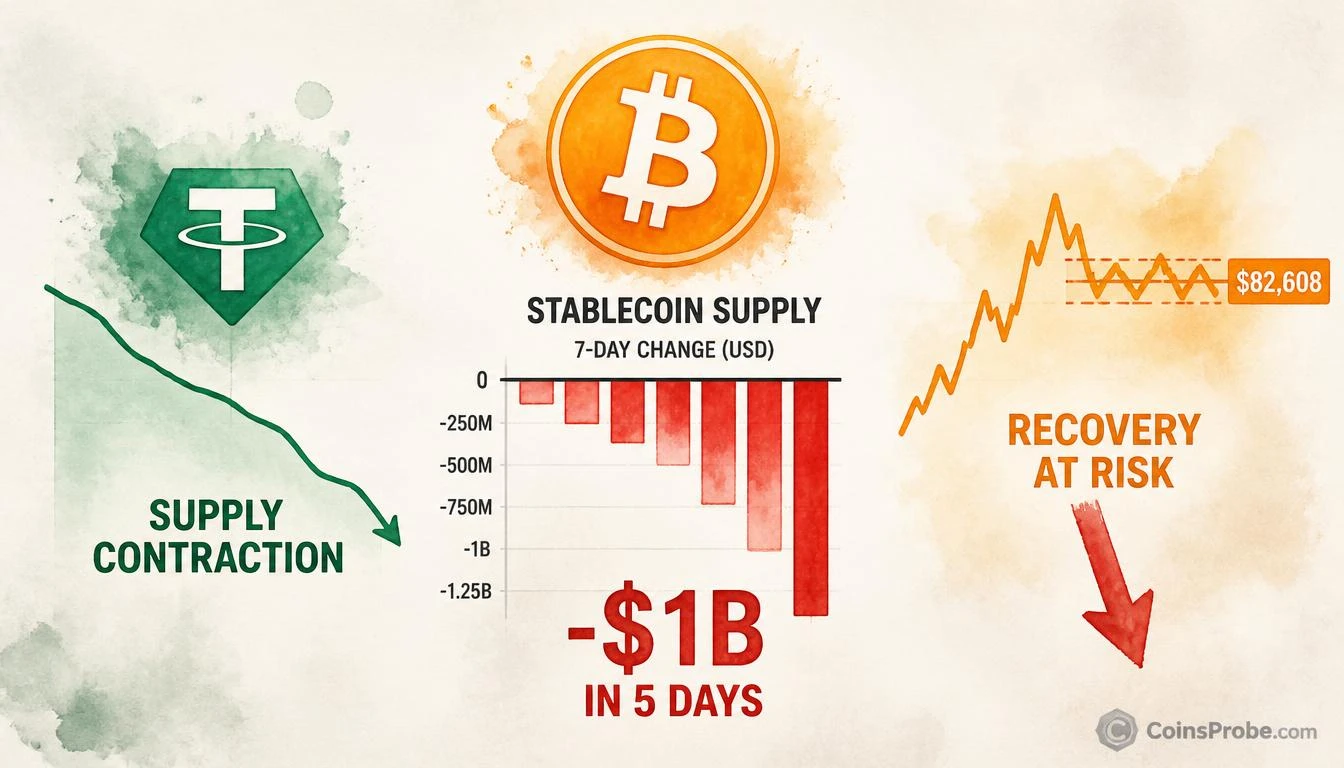
- Bitcoin trades at $82,608 (+1.24% 24h) as USDT supply contracts nearly $1B in 5 consecutive days per CryptoQuant
- CryptoQuant analyst @MorenoDV_ warns: recovery loses momentum if USDT supply keeps shrinking while BTC stalls
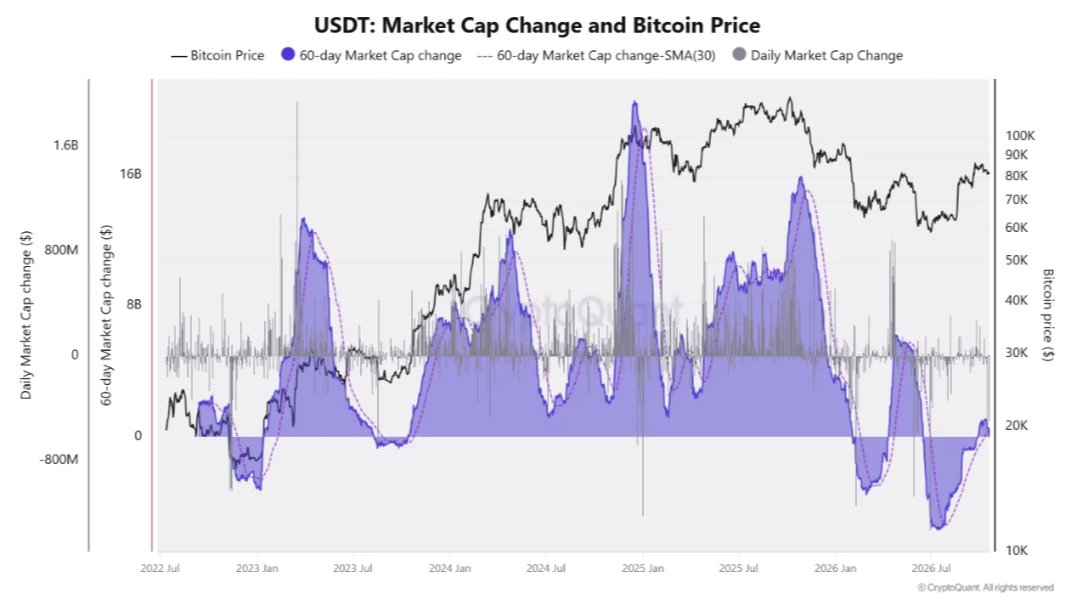
- 60-day USDT market cap change SMA is trending negative — a pattern last seen during the 2022 bear market trough near $20K
- Key metric to watch: CryptoQuant's daily USDT market cap change — net expansion required to confirm demand recovery
Bitcoin is attempting a recovery — but the fuel powering that recovery may be draining faster than the price suggests. At the time of writing, Bitcoin is trading at approximately $82,608, up 1.24% over the past 24 hours, with a market cap of $1.66 trillion. The critical variable is not on Bitcoin’s chart. It is on USDT’s.
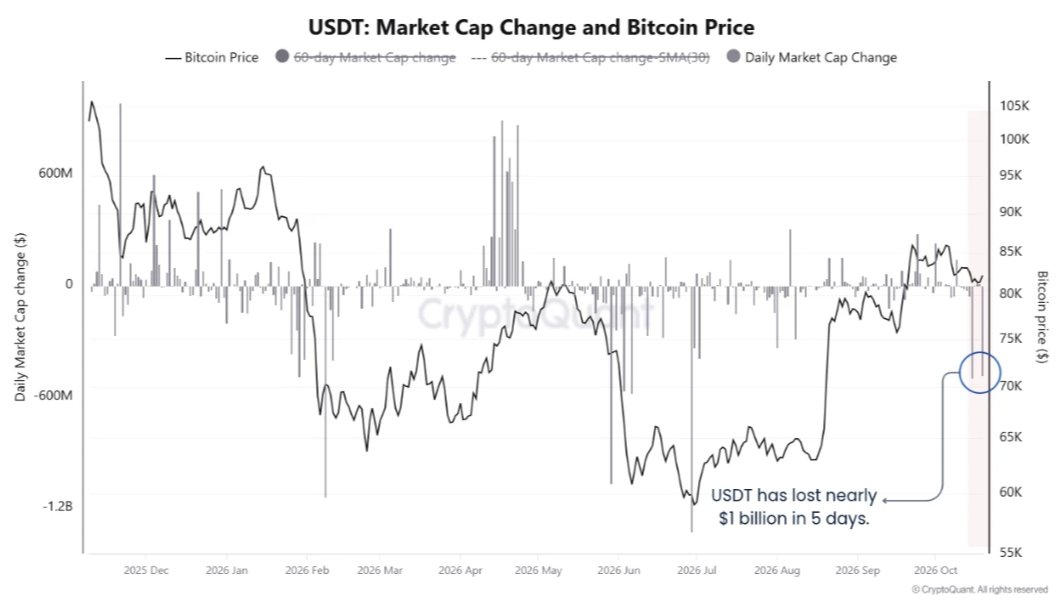
CryptoQuant analyst @MorenoDV_, writing on the CryptoQuant platform, issued a pointed warning on October 20, 2026: “If supply keeps shrinking while BTC stalls, the risk is that the recovery loses momentum before demand becomes strong enough to absorb renewed selling.” The trigger for that warning is a measurable, on-chain contraction — USDT has lost nearly $1 billion in supply over five consecutive days.
The Signal — $1 Billion in USDT Supply Vanishes in 5 Days
Stablecoin supply is not an abstract sentiment indicator. It is the literal stock of purchasing power sitting on-chain, available to flow into Bitcoin and other crypto assets. When USDT supply expands, it means more dollars are being tokenized and positioned for deployment. When it contracts, the opposite is true — holders are redeeming USDT back to fiat, reducing available buying capacity across the market.
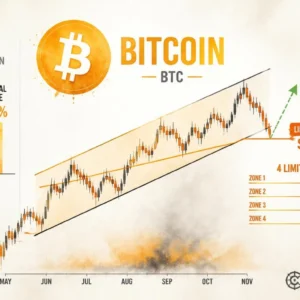
The CryptoQuant chart shared by @cryptoquant_com shows USDT’s daily market cap change over the period from approximately November 2025 through October 2026. A cluster of negative bars — circled in blue by the analyst — marks the most recent five-day window. The 60-day moving average of USDT market cap change, which had been trending positive through much of 2025’s bull run, has now turned and is trending downward. The annotation printed directly on the chart reads: “USDT has lost nearly $1 billion in 5 days.”
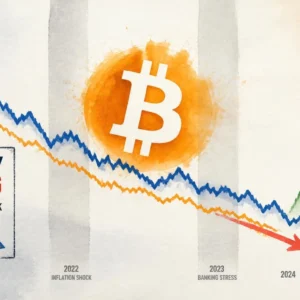
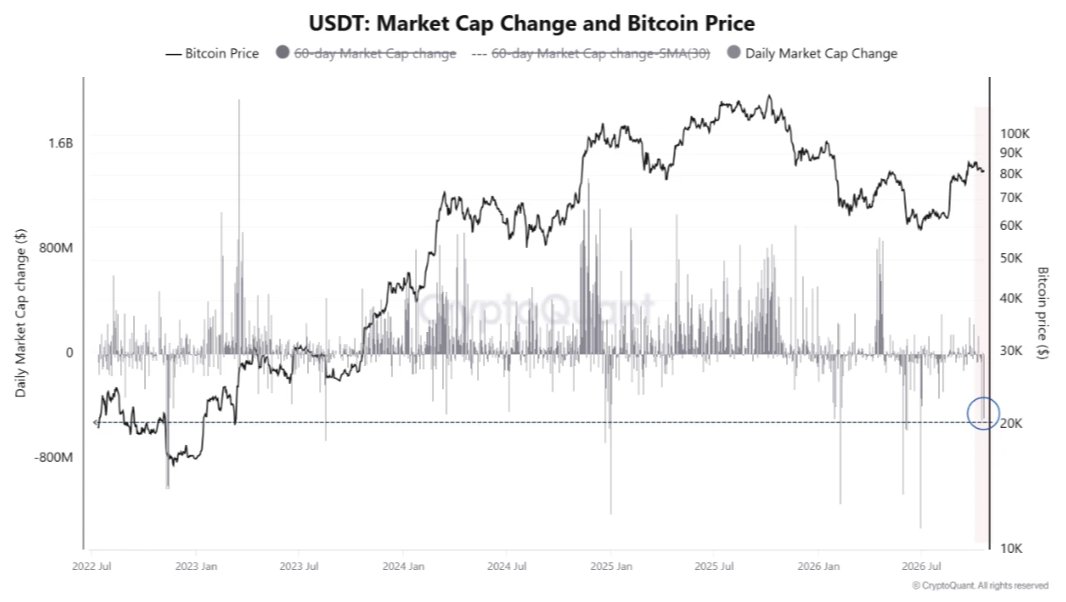
The longer-term chart extends the view back to July 2022, placing the current contraction in cycle context. During Bitcoin’s 2022 bear market trough — when BTC traded near the $20,000 level marked by the dashed reference line — USDT supply was also contracting sharply. The current negative bars in the daily market cap change series mirror that earlier episode, while Bitcoin’s price line shows a sharp rise from its late-2024 cycle peak, followed by a plateau and the current stall. The 30-day SMA of USDT daily market cap change is trending downward, consistent with the short-term signal.
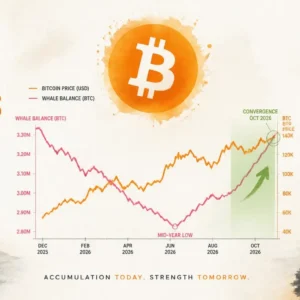
The third chart in the series overlays the 60-day USDT market cap change as a shaded area against Bitcoin’s price, from July 2022 through mid-2026. The purple 60-day area turns sharply negative in the most recent period, forming a deep trough — while Bitcoin’s price shows only a modest recovery bounce from its local low. This divergence is the analyst’s core concern: Bitcoin is attempting to recover, but the stablecoin fuel that would need to absorb renewed selling is simultaneously shrinking.
Why Stablecoin Contraction Matters More at a Stall Than at a Peak
The mechanism is straightforward. A Bitcoin recovery requires net buying pressure to sustain upward momentum — buyers need to continuously outpace sellers. Stablecoin supply is the clearest proxy for latent buying demand, because USDT on-chain represents capital that has already moved into the crypto ecosystem but has not yet been deployed into BTC or other assets.
When Bitcoin is rising strongly, stablecoin contraction is less alarming — it often means USDT is being converted directly into BTC, driving the rally. But when Bitcoin stalls — as it is doing now at $82,608 — and stablecoin supply contracts simultaneously, the picture is different. It means capital is leaving the ecosystem without being deployed into Bitcoin. The pool of available buyers is shrinking, not converting.
This is the specific risk @MorenoDV_ identifies: the recovery loses momentum not because of aggressive selling, but because buying demand fails to materialize at sufficient scale to absorb whatever selling pressure returns. This dynamic is what distinguishes a stalled recovery from a genuine consolidation before continuation. For broader context on what post-leverage-flush data shows for crypto’s largest assets, see Ethereum After the Binance Leverage Flush — What the Data Says Now.
What Confirms or Refutes the Risk
The analyst’s warning is conditional, not declarative. The phrase “if supply keeps shrinking” is the operative condition. A single five-day contraction of $1 billion in USDT supply does not guarantee Bitcoin’s recovery fails — it flags the risk that failure becomes more probable if the trend continues.
The metric to track is CryptoQuant’s USDT daily market cap change series. A reversal — USDT supply returning to net daily expansion — would indicate fresh capital entering the ecosystem and rebuilding the demand buffer. A continuation of negative daily bars would extend the supply drain and increase the probability that Bitcoin’s current stall becomes a reversal rather than a consolidation.
CryptoQuant updates this data in near-real time. At the time of writing, the trend is negative. Whether it stabilizes or deepens is the single most important on-chain question for Bitcoin’s near-term trajectory.
Bullish Scenario
USDT daily market cap change returns to positive territory — signaling fresh capital inflows — while Bitcoin holds above current levels. A reversal in the 60-day USDT SMA would confirm that the demand pool is rebuilding, providing the absorption capacity needed to sustain recovery momentum through renewed selling pressure.
Bearish Scenario
USDT supply contraction continues for additional sessions while Bitcoin fails to break above its current stall zone. Under this scenario, @MorenoDV_’s stated risk materializes: recovery momentum fades, and Bitcoin becomes vulnerable to losing ground before sufficient buying demand accumulates. No specific downside price level was stated by the analyst.
The on-chain picture right now is not a buy signal or a sell signal. It is a warning about the structural prerequisite for continuation — and that prerequisite is currently moving in the wrong direction. Bitcoin at $82,608 is attempting a recovery. USDT supply losing nearly $1 billion in five days is the precise condition that makes that attempt fragile. Watch CryptoQuant’s USDT market cap change series: a return to net daily expansion is the confirmation the recovery needs.
Frequently Asked Questions
Why does USDT supply contraction matter for Bitcoin’s price?
How much USDT supply has been lost and over what timeframe?
What would reverse the bearish stablecoin signal for Bitcoin?
Did CryptoQuant’s analyst give a specific Bitcoin price target or downside level?
Source: CryptoQuant · Published by CoinsProbe Markets Desk
The opinions and market insights shared on CoinsProbe represent the views of individual authors based on prevailing market conditions at the time of publication. Cryptocurrency investments carry significant risk and volatility. Readers are encouraged to conduct their own research and seek professional financial advice before making investment decisions. CoinsProbe and its contributors do not accept responsibility for financial losses or decisions made based on published content.
CoinsProbe may publish sponsored articles, affiliate links, or promotional collaborations. All sponsored material is clearly labeled to maintain transparency with our audience. Our editorial decisions remain fully independent, and advertising partnerships do not influence reviews, rankings, or published opinions.
Since 2023, CoinsProbe has delivered reliable insights on cryptocurrency, blockchain, and digital assets. Our content is created by experienced researchers and analysts who follow strict editorial standards focused on accuracy, transparency, and credibility. Every article is carefully reviewed and verified using trusted sources and current market data. We provide unbiased analysis and timely updates covering everything from emerging crypto projects to major industry developments.