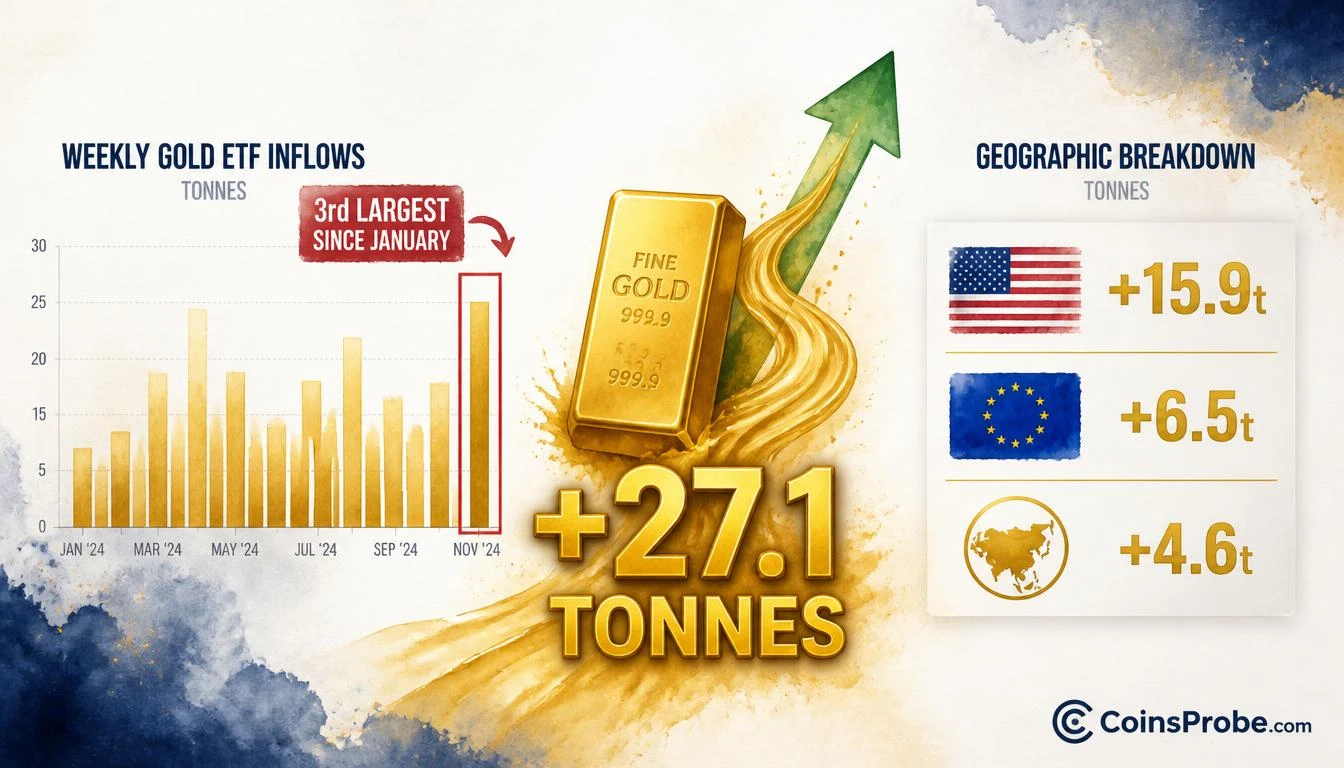
- Global physical gold ETFs recorded +27.1 tonnes last week — 3rd largest weekly inflow since January per World Gold Council data
- US led demand at +15.9 tonnes (58% of total), followed by Europe at +6.5t and Asia at +4.6t
- Three consecutive positive inflow weeks follow a -40 tonne outflow in July 2026 — potential trend reversal signal
- Watch November 2025's ~65-tonne peak: sustained approach confirms new gold demand cycle
Global physical gold-backed ETFs absorbed 27.1 tonnes in net inflows last week — the third-largest single-week inflow recorded since January, according to data shared by @KobeissiLetter citing World Gold Council figures.
The United States led all regions, accounting for 15.9 tonnes — more than 58% of total global demand for the week. Europe contributed 6.5 tonnes and Asia added 4.6 tonnes, making the demand picture genuinely multi-regional rather than a single-market anomaly.
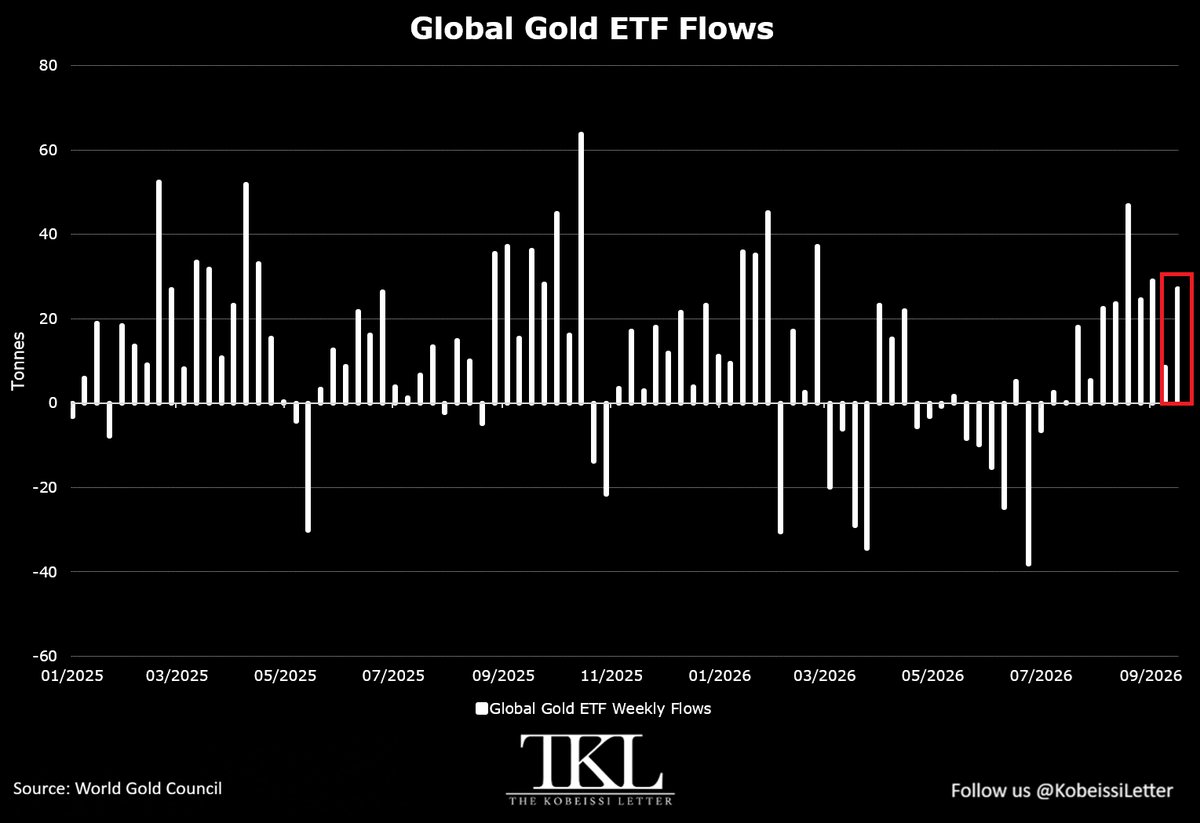
The weekly flow chart, spanning January 2025 through late 2026, places this reading in sharp relief. The dataset’s peak was approximately 65 tonnes in November 2025. A significant outflow period followed through mid-2026, reaching as deep as -40 tonnes in July 2026. Last week’s 27.1-tonne reading represents the third consecutive positive week after that drawdown — a sequence that, historically in this dataset, has preceded sustained demand cycles rather than one-off spikes.
The geographic breadth of the demand is the structural detail that distinguishes this reading. US-led physical gold ETF buying at this scale typically reflects either safe-haven positioning or dollar-hedge demand — not speculative flow. European and Asian follow-through at 6.5 and 4.6 tonnes respectively confirms the buying is not concentrated in a single market dynamic.
The key threshold to monitor going forward is whether weekly inflows build toward the November 2025 peak of ~65 tonnes. A sustained approach to that level would confirm a new demand accumulation cycle. A reversal back toward zero or negative territory — as occurred abruptly in mid-2026 — would invalidate the trend-reversal reading.
For context on the broader macro backdrop driving institutional safe-haven positioning, see our earlier coverage: Crypto Market Cap Reclaims $3 Trillion.
Source: x.com
Frequently Asked Questions
How large was the gold ETF inflow last week compared to 2025–2026 history?
Which region drove gold ETF demand last week?
Is three consecutive positive weeks after a drawdown significant for gold ETF trends?
Source: Kobeissiletter · Published by CoinsProbe Markets Desk
The opinions and market insights shared on CoinsProbe represent the views of individual authors based on prevailing market conditions at the time of publication. Cryptocurrency investments carry significant risk and volatility. Readers are encouraged to conduct their own research and seek professional financial advice before making investment decisions. CoinsProbe and its contributors do not accept responsibility for financial losses or decisions made based on published content.
CoinsProbe may publish sponsored articles, affiliate links, or promotional collaborations. All sponsored material is clearly labeled to maintain transparency with our audience. Our editorial decisions remain fully independent, and advertising partnerships do not influence reviews, rankings, or published opinions.
Since 2023, CoinsProbe has delivered reliable insights on cryptocurrency, blockchain, and digital assets. Our content is created by experienced researchers and analysts who follow strict editorial standards focused on accuracy, transparency, and credibility. Every article is carefully reviewed and verified using trusted sources and current market data. We provide unbiased analysis and timely updates covering everything from emerging crypto projects to major industry developments.