
- Bitcoin trades at $81,105 — down 2.82% in 24h — as Alphractal flags a Buy/Sell Pressure Delta rollover
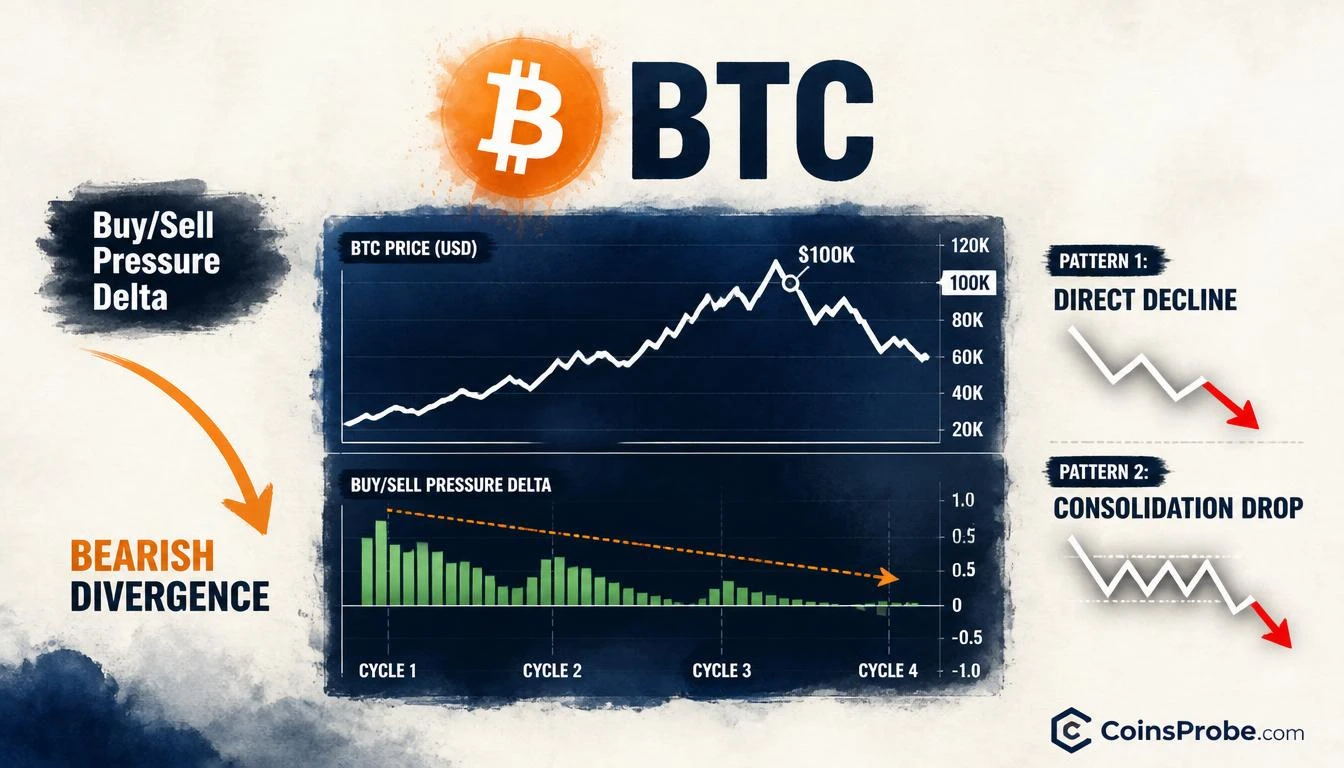
- Two historical patterns follow a Delta decline: direct drop into negative territory, or consolidation forming a larger drop
- Bearish divergence confirmed on weekly chart: buy pressure peaks declining cycle-over-cycle even as BTC reached ~$100K
- Current Delta reading is "slight" and "not yet concerning" — but directional shift matches early-stage conditions of both bearish patterns
Bitcoin is trading at $81,105 — down 2.82% in the past 24 hours, with a market cap of $1.63 trillion. The decline is accompanied by a specific on-chain shift that Alphractal (@Alphractal) is now flagging as a signal worth monitoring: the Buy/Sell Pressure Delta is showing a slight but measurable decline in buying pressure.
Alphractal’s alert is direct: “Bitcoin’s Buy/Sell Pressure Delta Shows a Slight Decline in Buying Pressure. In a bearish scenario, this metric typically continues declining for several days, eventually moving into negative territory.” The metric is not yet at an extreme reading — but the direction of the shift, and what history shows tends to follow it, is the operative concern.
What the Buy/Sell Pressure Delta Actually Measures
The Buy/Sell Pressure Delta is not a price indicator. It is a composite metric tracking the net balance between aggressive buying activity and aggressive selling activity across on-chain and derivatives data. A positive reading means buyers are in control; a reading trending toward zero signals that bullish momentum is fading; a negative reading signals that sellers have taken the upper hand.
What makes the current reading notable is not the absolute level — Alphractal describes it as “slight” and “not yet concerning” — but the directional turn. The chart shared by @Alphractal shows buy pressure peaks declining progressively cycle-over-cycle even as Bitcoin’s price had climbed toward $100K, a classic bearish divergence structure: price making higher levels while the underlying demand engine weakens with each successive peak.
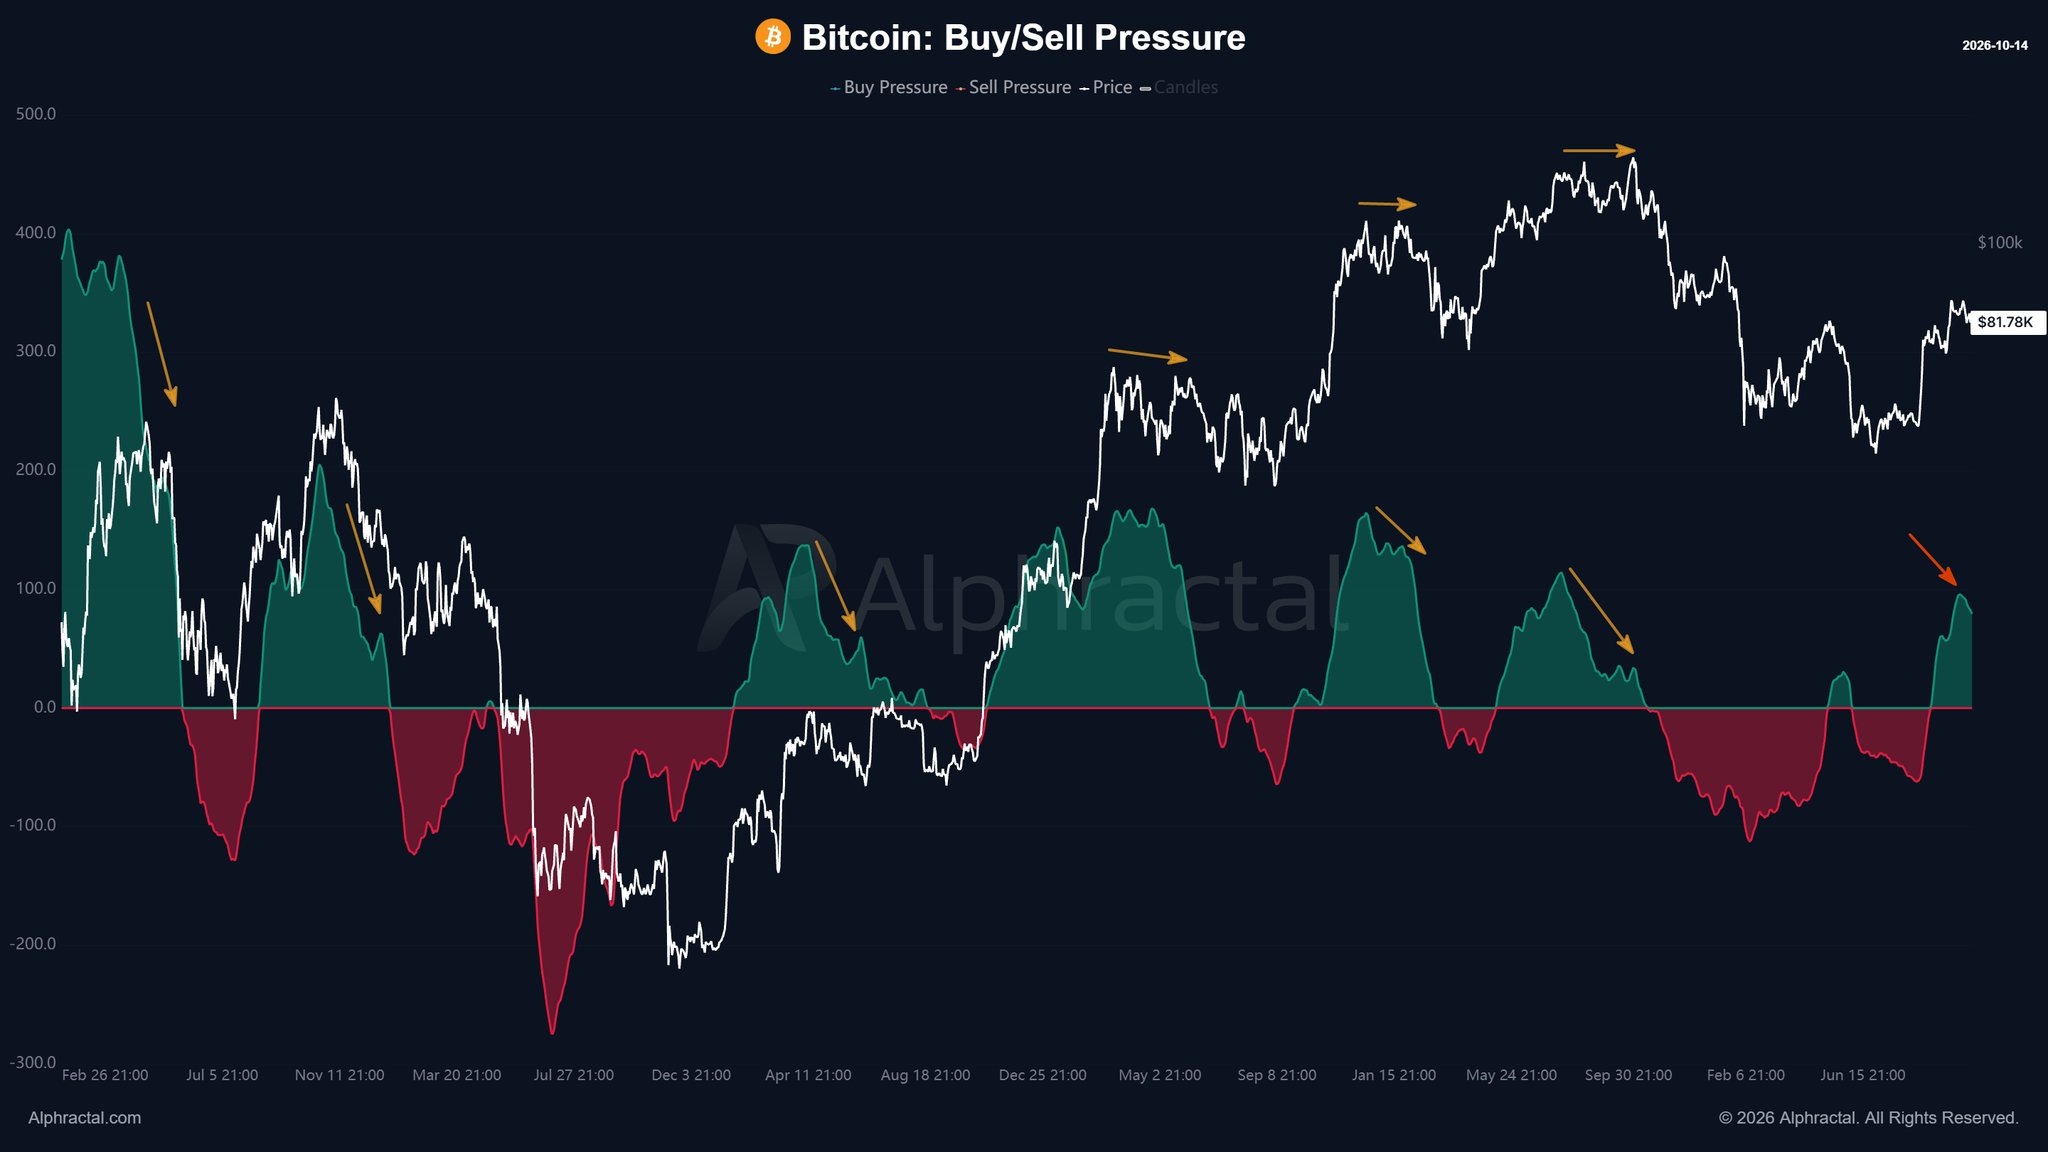
The chart covers approximately February 2025 through October 2026 on a weekly timeframe. Green areas represent buy pressure; red areas represent sell pressure; the white line tracks Bitcoin’s price. Orange arrows annotate the divergence explicitly — each green (buy pressure) peak is lower than the prior one, while the price line peaked near $100K before declining. The most recent green area is rising modestly but remains subdued relative to earlier cycle peaks, with a downward arrow marking the current slight rollover in buying pressure.
Two Recurring Historical Patterns — What Follows When the Delta Stops Rising
Alphractal’s note identifies two distinct historical patterns that emerge when the Buy/Sell Pressure Delta ceases to rise and begins rolling over:
Pattern 1 — Direct Price Decline: The metric continues declining for several days, eventually moving into negative territory. During this phase, sellers gain incremental control, and price follows the metric lower. This is the straightforward bearish resolution.
Pattern 2 — Consolidation Leading to a Larger Drop: The metric pauses rather than collapsing immediately. This pause forms what Alphractal describes as a “cause-and-effect” structure — a period of sideways price action that appears stable on the surface but is building distribution pressure. The result is a larger decline when the consolidation resolves.
Both patterns begin from the same initial condition: a slight, early decline in the Delta — precisely what is visible now. The March 2026 period was cited in Alphractal’s thread as an example of how this sequence played out in a recent cycle, though no specific price levels or percentage declines were stated for that instance.
| Pattern Type | Initial Signal | Typical Development | Resolution |
|---|---|---|---|
| Pattern 1 — Direct Decline | Delta rolls over slightly | Metric continues lower for days | Delta enters negative territory; price follows |
| Pattern 2 — Consolidation | Delta rolls over slightly | Price consolidates; pressure builds | “Cause-and-effect” structure resolves in larger drop |
Source: @Alphractal (X), October 14 2026
What the Bearish Divergence on the Chart Adds
The divergence structure is a meaningful addition to the raw Delta reading. In a healthy bull market, each wave of buying should produce a buy pressure peak at least equal to the prior one. The chart shows the opposite — each successive green peak is lower than the last across the February 2025 to October 2026 window, even as Bitcoin’s price reached approximately $100K.
This divergence does not predict a specific price outcome with precision. What it confirms is that the demand engine driving each successive rally has been running at progressively lower capacity. When the Delta now shows its first directional decline from this already-weakening baseline, the historical patterns Alphractal identifies become relevant. For context on how other assets are behaving in the current environment, see our recent analysis of Ethereum October Spot Trading: Selling Leads by $251.7M on Binance.
What the Metric Does and Does Not Say
What it says: Buying momentum is declining. The Delta is no longer rising, and the directional shift matches the early-stage conditions that preceded both Pattern 1 and Pattern 2 outcomes historically.
What it does not say: It does not confirm which of the two patterns will follow. It does not specify a price target, a support level, or a timeline. Alphractal explicitly describes the current reading as “slight” and “not yet concerning” — the signal is a watch condition, not a confirmed breakdown.
What to watch for continuation: Alphractal recommends platform alerts for an intensification of selling pressure. If the Delta continues declining over the next several days rather than stabilizing, Pattern 1 — a direct move into negative territory — becomes the active scenario. If price stalls sideways while the Delta oscillates without recovering, Pattern 2’s consolidation structure is forming.
Bullish Scenario
If the Buy/Sell Pressure Delta stabilizes and begins recovering before entering negative territory, the rollover would be classified as a short-term pause rather than a structural shift. Bitcoin would need to reclaim buying pressure sufficient to produce a Delta peak above the most recent prior peak to invalidate the bearish divergence pattern on the weekly chart.
Bearish Scenario
If the Delta continues declining for several days and moves into negative territory — consistent with Alphractal’s Pattern 1 — that would confirm sellers have taken control of the momentum balance. Pattern 2 carries an additional risk: a consolidation period that appears stable could mask building distribution, resolving as a larger drop than Pattern 1’s direct decline.
At $81,105, Bitcoin is already 18.9% below the $100K level visible as the price peak on Alphractal’s chart. The Delta rollover is occurring from a structurally weakened buying baseline. Alphractal’s two documented patterns both resolve to the downside — the open question is whether it happens directly or after a consolidation phase. The Delta’s behavior over the next several trading days will determine which scenario is active. Watch for the metric to either stabilize and recover, or continue declining toward negative territory — that is the single most informative variable from this signal.
Frequently Asked Questions
What is the Bitcoin Buy/Sell Pressure Delta and why does it matter?
What are the two historical patterns Alphractal identifies when the Delta stops rising?
Does a declining Buy/Sell Pressure Delta confirm Bitcoin will drop further?
What specific level or metric should traders monitor to determine which pattern is active?
Source: Alphractal · Published by CoinsProbe Markets Desk
The opinions and market insights shared on CoinsProbe represent the views of individual authors based on prevailing market conditions at the time of publication. Cryptocurrency investments carry significant risk and volatility. Readers are encouraged to conduct their own research and seek professional financial advice before making investment decisions. CoinsProbe and its contributors do not accept responsibility for financial losses or decisions made based on published content.
CoinsProbe may publish sponsored articles, affiliate links, or promotional collaborations. All sponsored material is clearly labeled to maintain transparency with our audience. Our editorial decisions remain fully independent, and advertising partnerships do not influence reviews, rankings, or published opinions.
Since 2023, CoinsProbe has delivered reliable insights on cryptocurrency, blockchain, and digital assets. Our content is created by experienced researchers and analysts who follow strict editorial standards focused on accuracy, transparency, and credibility. Every article is carefully reviewed and verified using trusted sources and current market data. We provide unbiased analysis and timely updates covering everything from emerging crypto projects to major industry developments.