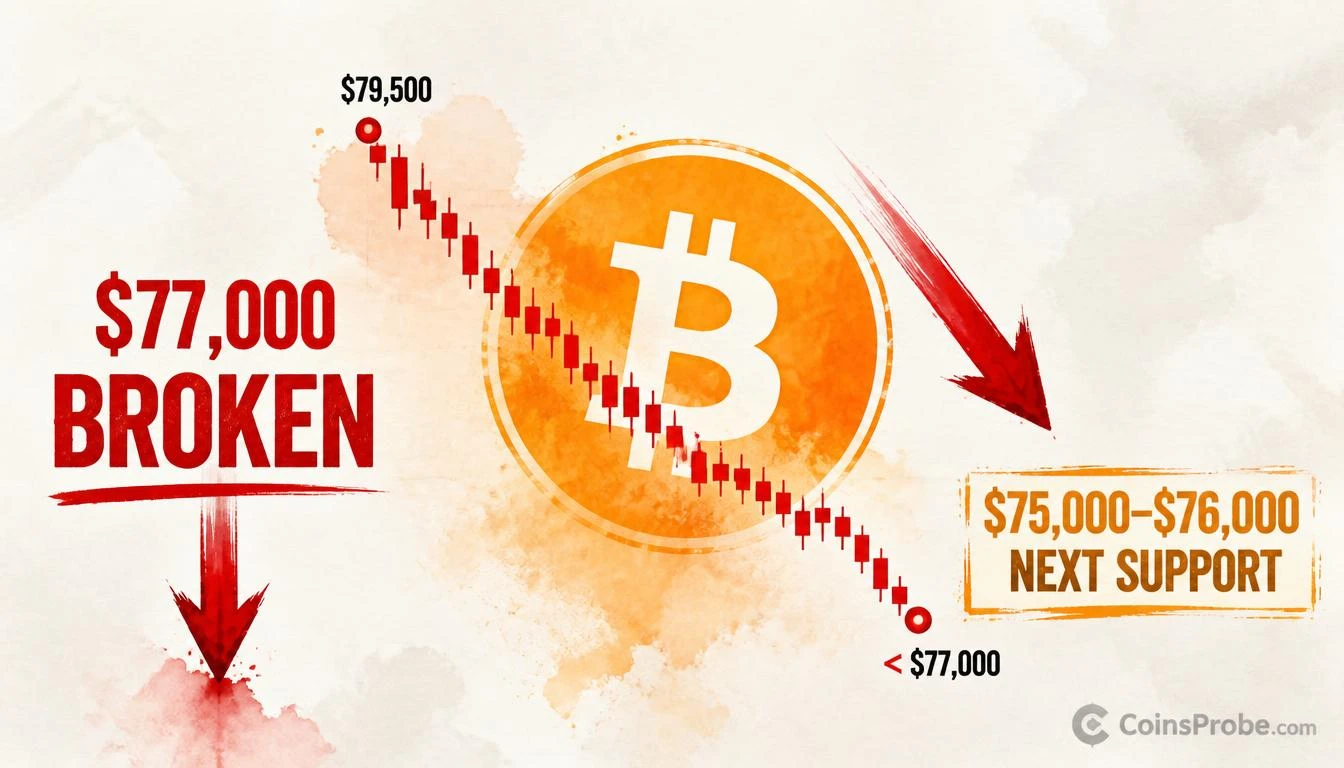

- Bitcoin drops below $77,000 psychological support — down 3.1% from $79,500 intraday peak per WatcherGuru
- Continuous red candles with zero consolidation — structure consistent with panic selling or cascading liquidations
- Next key support zone: $75,000–$76,000; reclaim of $77,000 needed to neutralize bearish momentum
Bitcoin has broken below the $77,000 psychological support level — a sharp, uninterrupted reversal from an intraday peak of approximately $79,500, according to WatcherGuru.
At the time of writing, Bitcoin is trading at approximately $77,076 — down 0.85% over the past 24 hours, with a market capitalization of approximately $1.548 trillion and 24-hour volume of $31.77 billion.
The move represents a drop of roughly $2,500 (-3.1%) from the session high. Notably, the intraday chart shows no consolidation during the decline — a sequence of continuous red candles with no meaningful bounce, a structure consistent with panic selling or cascading liquidations rather than an orderly pullback.

Bitcoin intraday chart — sharp reversal from $79,500 to sub-$77,000 | Source: @WatcherGuru (X)
What the Chart Shows
The intraday structure is a textbook sharp reversal: an aggressive rally to $79,500 followed by an equally aggressive sell-off, with price printing new lows at the bottom of the chart. The $77,000 level had served as a psychological support floor; its loss opens a potential test of the $75,000–$76,000 zone as the next area of interest.
The absence of bounce candles during the drop is the key concern for near-term bulls. Stabilization and a confirmed support structure are required before the short-term bias shifts.
This move comes amid rising macro pressure — Fed rate hike odds surged to 64% following hotter-than-expected PPI data, adding headwinds to risk assets including Bitcoin. Notably, Bitcoin’s correlation with gold has risen to near a six-year high of +0.50, while its Nasdaq linkage has dropped to a one-year low — a regime shift worth monitoring as macro conditions evolve.
Key Levels to Watch
- $77,000 — psychological support, now broken
- $75,000–$76,000 — next support zone per intraday structure
- $79,500 — session high; reclaim required to neutralize bearish momentum
Watch $75,000 as the level that, if lost, opens a deeper retest of the broader range floor. Reclaim of $77,000 on a sustained basis is the minimum requirement to stabilize near-term structure.
Frequently Asked Questions
How far did Bitcoin drop below $77,000?
What is the next support level after Bitcoin broke $77,000?
What does the continuous red candle sequence indicate?
Source: WatcherGuru · Published by CoinsProbe Markets Desk
The opinions and market insights shared on CoinsProbe represent the views of individual authors based on prevailing market conditions at the time of publication. Cryptocurrency investments carry significant risk and volatility. Readers are encouraged to conduct their own research and seek professional financial advice before making investment decisions. CoinsProbe and its contributors do not accept responsibility for financial losses or decisions made based on published content.
CoinsProbe may publish sponsored articles, affiliate links, or promotional collaborations. All sponsored material is clearly labeled to maintain transparency with our audience. Our editorial decisions remain fully independent, and advertising partnerships do not influence reviews, rankings, or published opinions.
Since 2023, CoinsProbe has delivered reliable insights on cryptocurrency, blockchain, and digital assets. Our content is created by experienced researchers and analysts who follow strict editorial standards focused on accuracy, transparency, and credibility. Every article is carefully reviewed and verified using trusted sources and current market data. We provide unbiased analysis and timely updates covering everything from emerging crypto projects to major industry developments.