
Date: Thu, Aug 28, 2025 | 05:44 PM GMT
The cryptocurrency market is experiencing notable volatility as Ethereum (ETH) briefly dipped to $4,490 from its 24-hour high of $4,642, marking a 3% drop and adding slight pressure across major altcoins.
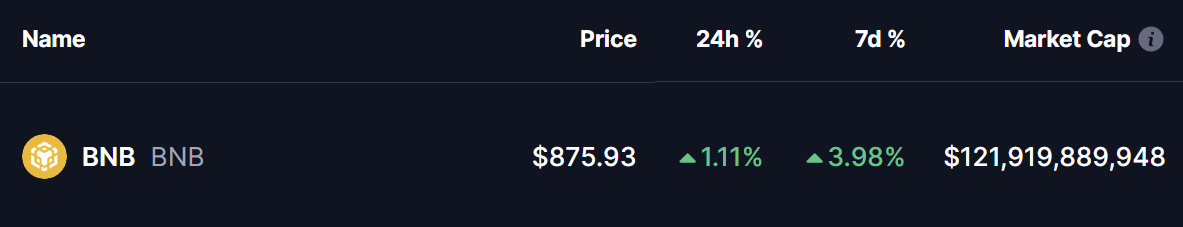
However, Binance Coin (BNB) has managed to stay in the green today. More importantly, its latest chart structure reveals a key harmonic pattern that could be signaling further upside potential in the near term.
Harmonic Pattern Hints at Potential Bounce
On the daily chart, BNB is forming a Bearish ABCD harmonic pattern — a setup that, despite its name, typically delivers a bullish CD-leg rally before testing the Potential Reversal Zone (PRZ).
The structure began with a rally from Point A near $729.4 to Point B, followed by a pullback to Point C around $829.0, where strong buying pressure reemerged. Since then, BNB has advanced to around $875, confirming that the CD leg is underway.
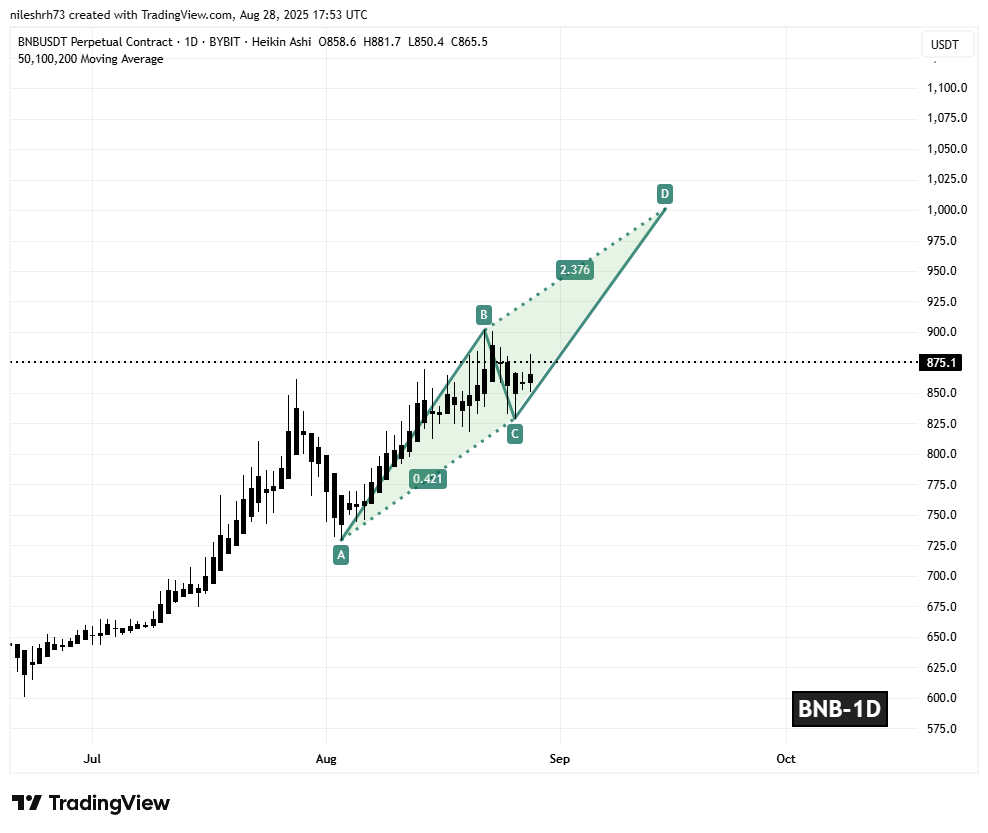
If the pattern develops according to the classical ABCD projection, the CD leg could extend to the 2.37 Fibonacci projection of the BC leg, placing the PRZ at approximately $1,001 — around 14% higher than current levels.
What’s Next for BNB?
If bullish momentum holds, BNB could climb toward the $1,001 resistance zone. However, this level is expected to act as a major barrier, where short-term traders may look to book profits, potentially causing a pullback.
Before that target is reached, traders should also remain mindful of possible retracements toward edge support.

Overall, the harmonic structure suggests that BNB remains in a bullish phase, with higher levels still on the table if buyers maintain control.
Disclaimer: This article is for informational purposes only and not financial advice. Always conduct your own research before investing in cryptocurrencies.

The opinions and market insights shared on CoinsProbe represent the views of individual authors based on prevailing market conditions at the time of publication. Cryptocurrency investments carry significant risk and volatility. Readers are encouraged to conduct their own research and seek professional financial advice before making investment decisions. CoinsProbe and its contributors do not accept responsibility for financial losses or decisions made based on published content.
CoinsProbe may publish sponsored articles, affiliate links, or promotional collaborations. All sponsored material is clearly labeled to maintain transparency with our audience. Our editorial decisions remain fully independent, and advertising partnerships do not influence reviews, rankings, or published opinions.
Since 2023, CoinsProbe has delivered reliable insights on cryptocurrency, blockchain, and digital assets. Our content is created by experienced researchers and analysts who follow strict editorial standards focused on accuracy, transparency, and credibility. Every article is carefully reviewed and verified using trusted sources and current market data. We provide unbiased analysis and timely updates covering everything from emerging crypto projects to major industry developments.