
Date: Sun, Jan 12, 2025, 05:17 AM GMT
The cryptocurrency market has been undergoing corrections over the past month, staying true to January’s historically bearish trends. Bitcoin (BTC) faced a sharp correction this week, plunging from $102K to a low of $91K. However, Bitcoin has currently stabilized near the $94K level, which has allowed several altcoins to regain composure and prepare for potential recoveries.
Despite the ongoing market correction, Binance Coin (BNB) has demonstrated strong resilience with only a narrow decline, supported by a technical setup indicating signs of accumulation.

Notably, the CEX token narrative is already heating up, highlighted by the stellar performance of Bitget Token (BGB), which has surged by a massive 430% over the past 60 days.
BNB’s Ascending Triangle Pattern
According to crypto analyst @JohncyCrypto, Binance Coin is forming a textbook ascending triangle pattern on the weekly chart. This bullish formation highlights a steady phase of accumulation as buyers gradually push prices higher.
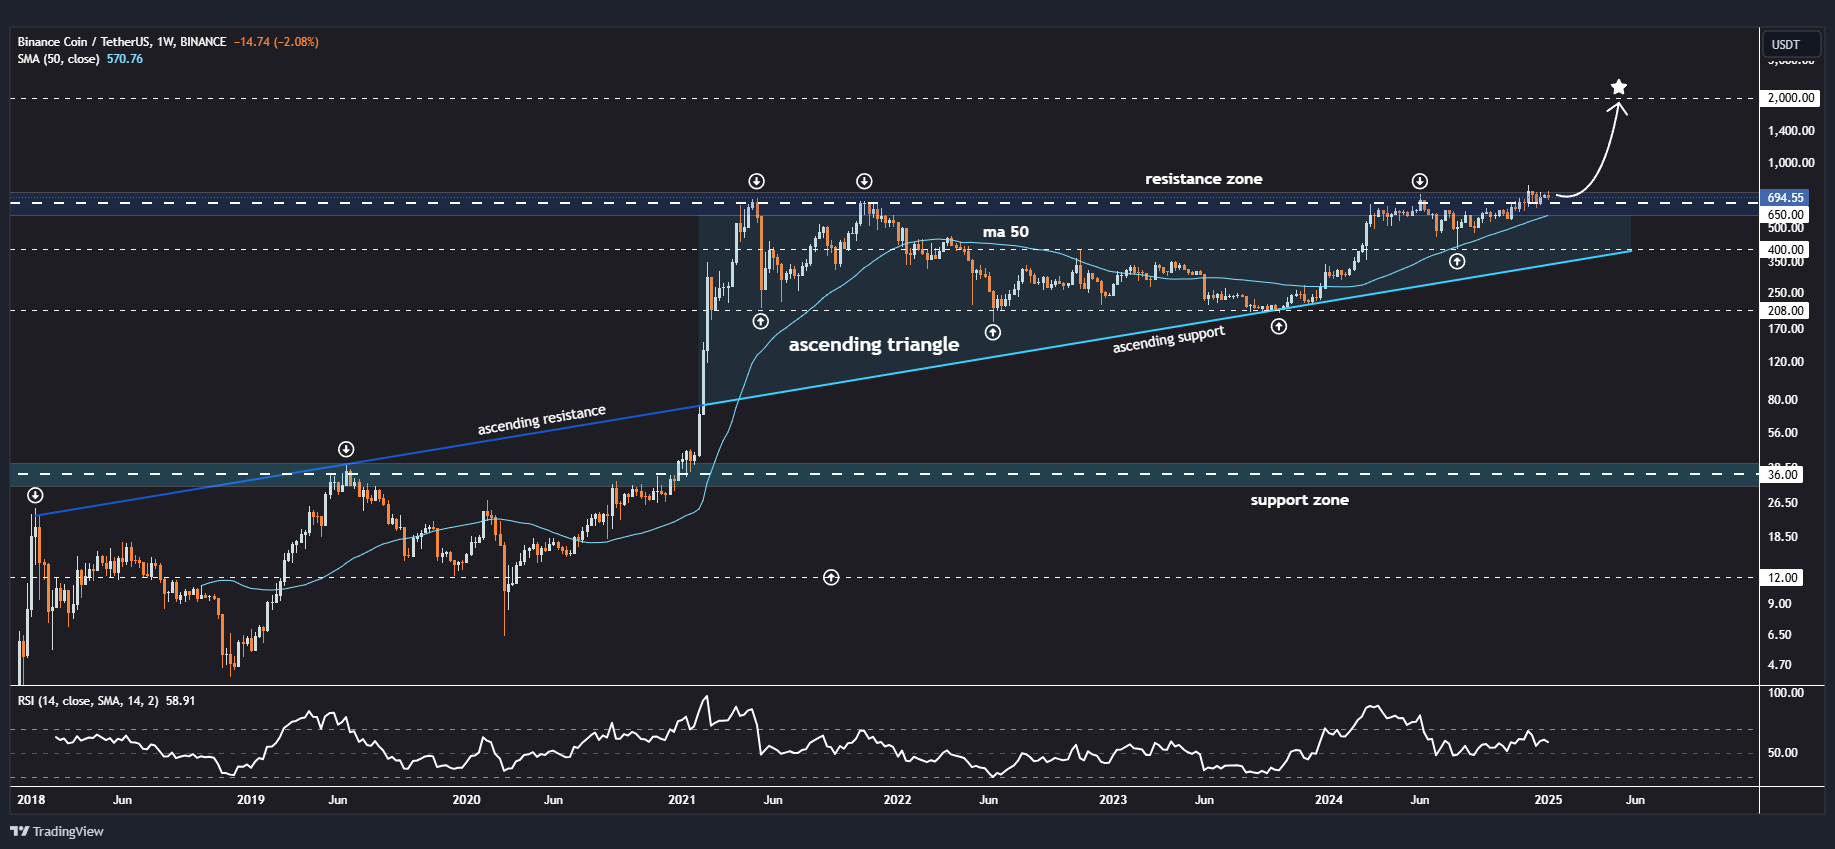
The chart reveals a series of higher lows, which indicates growing buying interest despite broader market uncertainty. The ascending resistance line, which marks the triangle’s upper boundary, is positioned near the $700-$750 zone. A decisive breakout above this resistance could potentially trigger a significant bullish move.
Key Levels to Watch:
As per analyst’s analysis:
- Immediate Resistance: $700–$750
- Potential Targets After Breakout: $1,000, $1,500, and ultimately $2,000.
- Support Zone: $350-$400, with the 50-week moving average (SMA) acting as a key dynamic support.
The accompanying chart confirms these observations. BNB is trading within the bounds of the ascending triangle, with strong support provided by the ascending trendline and the 50-week SMA. The RSI indicator also signals moderate momentum at 58.91, leaving room for further upside before reaching overbought territory.
Signs of Accumulation
The higher lows in the pattern suggest a phase of accumulation, where buyers are consistently entering the market at higher price levels. This behavior typically precedes a breakout, as demand outpaces supply. With BNB showing limited downside during market corrections, the token appears poised for a bullish breakout if Bitcoin stabilizes.
Is a Bullish Breakout Ahead?
The technical setup for Binance Coin points toward a potential breakout. If BNB successfully breaches the $700-$750 resistance zone, it could trigger a strong rally toward $1,000 and beyond. Analysts have identified $2,000 as a long-term target if broader market conditions support continued momentum.
However, the success of this bullish scenario will depend heavily on Bitcoin’s stability. If BTC manages to hold above its $91K-$94K support range, it could boost confidence across the altcoin market. Additionally, the upcoming inauguration of Donald Trump on January 20, known for his pro-crypto stance, could further bolster market sentiment and provide additional catalysts for BNB’s breakout.
Conclusion
Binance Coin is currently in a pivotal position as it trades near the resistance zone of its ascending triangle pattern. With strong signs of accumulation and growing buyer interest, BNB has the potential to stage a significant rally in the coming weeks. However, macroeconomic factors and Bitcoin’s performance will play a crucial role in determining whether this bullish setup materializes.

Disclaimer: This article is for informational purposes only and does not constitute financial advice. Always conduct your own research before making investment decisions.
The opinions and market insights shared on CoinsProbe represent the views of individual authors based on prevailing market conditions at the time of publication. Cryptocurrency investments carry significant risk and volatility. Readers are encouraged to conduct their own research and seek professional financial advice before making investment decisions. CoinsProbe and its contributors do not accept responsibility for financial losses or decisions made based on published content.
CoinsProbe may publish sponsored articles, affiliate links, or promotional collaborations. All sponsored material is clearly labeled to maintain transparency with our audience. Our editorial decisions remain fully independent, and advertising partnerships do not influence reviews, rankings, or published opinions.
Since 2023, CoinsProbe has delivered reliable insights on cryptocurrency, blockchain, and digital assets. Our content is created by experienced researchers and analysts who follow strict editorial standards focused on accuracy, transparency, and credibility. Every article is carefully reviewed and verified using trusted sources and current market data. We provide unbiased analysis and timely updates covering everything from emerging crypto projects to major industry developments.