Date: Mon, Dec 09, 2024, 05:30 AM GMT
The cryptocurrency market has been on an upward trajectory over the past month, fueled by a Bitcoin (BTC) rally that saw its price soar by nearly 30% in the last 30 days. Recently, BTC achieved a new all-time high of $103,900, setting a bullish tone across the market.
This surge in Bitcoin has helped major altcoins gain traction, and Beam (BEAM), a Gaming token, has emerged as a strong contender. BEAM has recorded a remarkable 67% monthly surge, catching investors’ attention as it approaches a significant technical breakout.

Eyeing For Mega Breakout
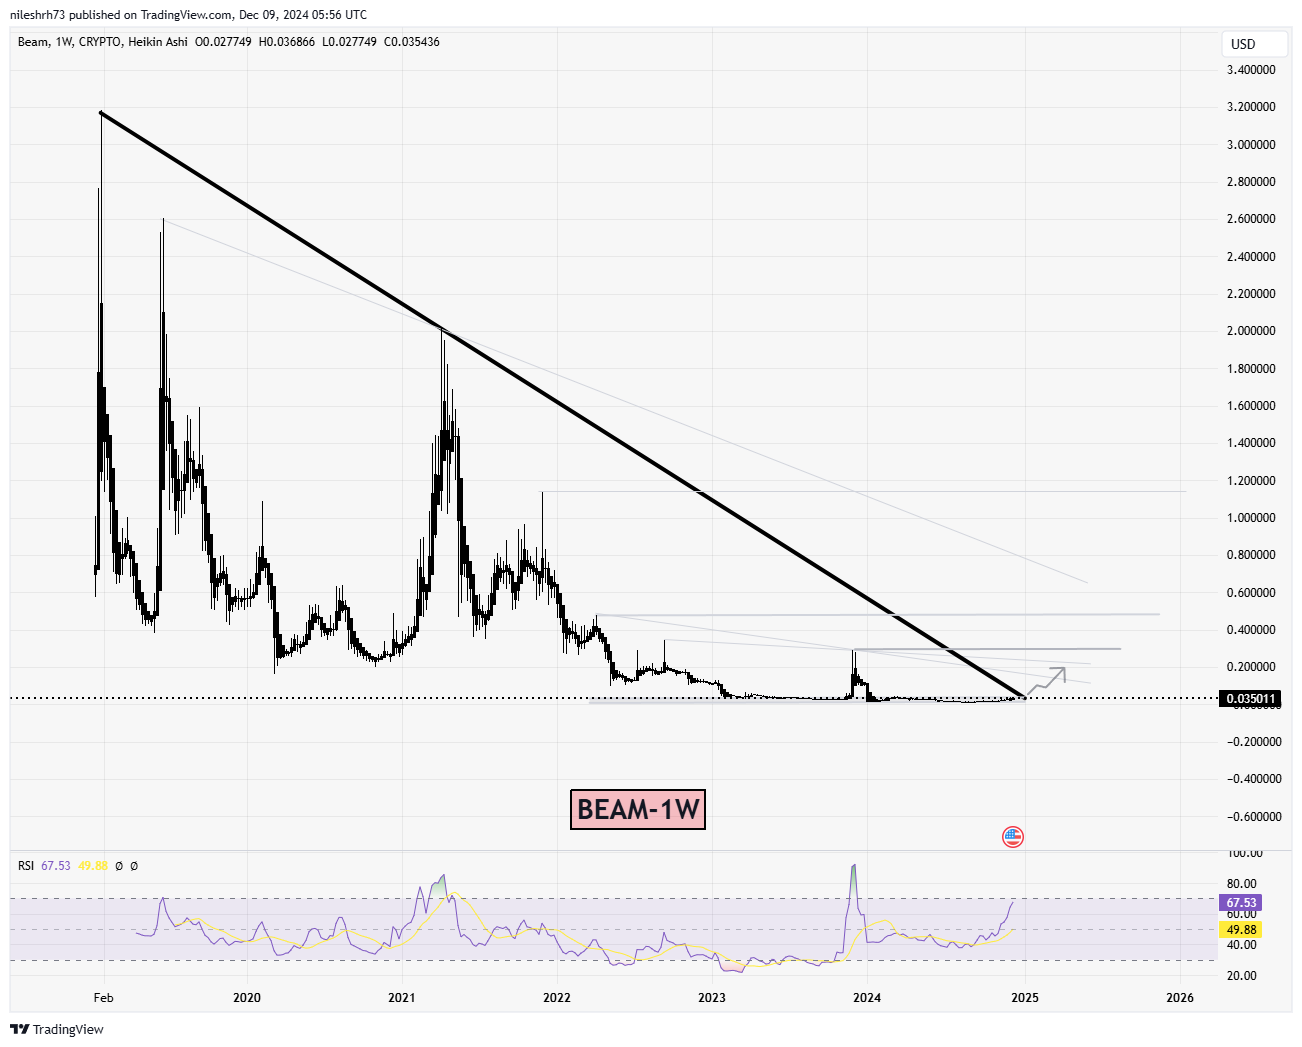
The first chart provides a macro view of BEAM’s price action on the weekly timeframe. For over three years, BEAM has been trapped in a persistent downtrend, defined by a descending trendline that acted as a formidable resistance. However, recent price movements suggest the token is finally building the momentum required to challenge this trendline.

- Descending Trendline: The black trendline shows the long-term resistance that has dictated BEAM’s price action since 2020. A breakout above this line could signify the end of the bear cycle.
- Support Base: The price has been consolidating near the $0.03 level, which appears to act as a strong support zone, suggesting investor confidence in this range.
- RSI Signal: The Relative Strength Index (RSI) is hovering near 50, indicating a neutral position but with upward momentum, which is typically seen before a breakout.
This broader view indicates that BEAM is at a pivotal moment where a breakout from this trendline could lead to significant upward movement.
Detailed Analysis from the Second Chart:
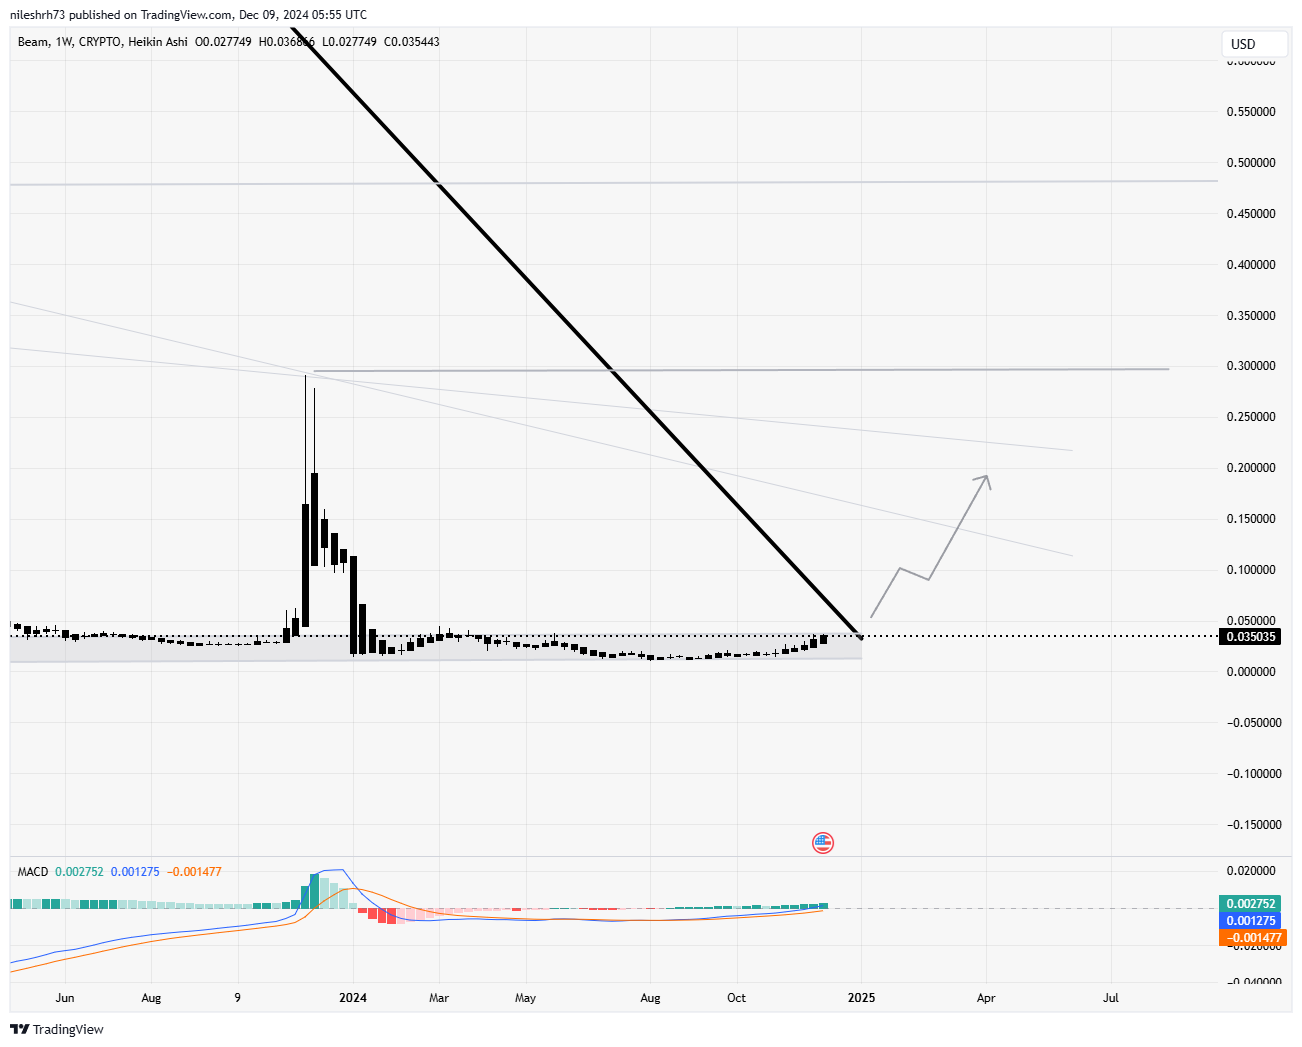
The second chart zooms in to provide a closer look at BEAM’s price action and recent developments, focusing on the shorter-term potential breakout scenario.

Key Observations:
1.Price Compression: The chart shows BEAM’s price tightly compressing under the descending trendline near the $0.03-$0.04 range, suggesting reduced volatility and a buildup of energy for a breakout.
2.MACD Bullish Signal:
The Moving Average Convergence Divergence (MACD) indicator on the weekly timeframe reveals a bullish crossover, with the MACD line crossing above the signal line.
The histogram bars are turning positive, which is an early sign of a potential trend reversal.
3.Breakout Scenarios:
Upside Targets: If BEAM successfully breaks above the descending trendline, the next immediate resistance levels will be at the upside trendlines, which are around $0.14 and $0.23. A sustained rally beyond these levels could potentially see BEAM testing higher zones, as indicated in the zoomed chart.
What’s Next for BEAM?
BEAM is at a critical juncture. A confirmed breakout above the $0.045 level would mark a significant milestone, potentially drawing in more bullish investors. The immediate price targets would be $0.14, followed by $0.23, where profit-taking might occur. On the downside, a failure to break the trendline could see BEAM revisiting its support levels near $0.02-$0.03.
Disclaimer: This article is for informational purposes only and not financial advice. Always conduct your own research before investing in cryptocurrencies.


