

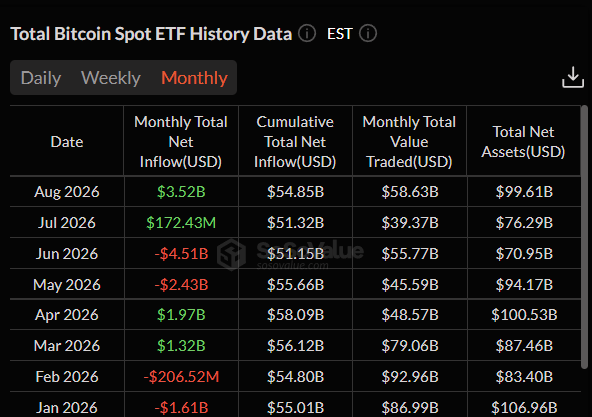
- U.S. Bitcoin spot ETFs recorded $3.52 billion in net inflows in August 2026 — the largest monthly total of 2026 — reversing $4.51 billion in June outflows as institutional demand returned in force.
- Bitcoin is trading near $79,155 — up 24.87% over 30 days — but stalling beneath the $79,400–$79,500 skyline resistance that analyst @Wild_Randomness identifies as the key fractal invalidation level.
- The October 2025 fractal remains active: a close above $79,500 and reclaim of $81,500 invalidates the bearish pattern, while a drop below $76,800–$77,000 opens the path toward a $67,000 downside target.
Bitcoin is sitting at one of the more precisely defined decision points it has produced in 2026 — and the data on either side of the debate is unusually clear. On the bullish side: U.S. spot ETFs just delivered $3.52 billion in August inflows, the strongest monthly institutional demand reading of the year. On the cautious side: the weekly chart is tracking a fractal that preceded one of 2025’s sharpest drawdowns — and the key rejection zone from that prior pattern sits almost exactly where Bitcoin is stalling right now.
At the time of writing, BTC is trading at approximately $79,155 — up 1.49% in 24 hours and 24.87% over 30 days — with a market capitalization of approximately $1.58 trillion. The decision level is here. The levels that resolve it are specific and testable.

Bitcoin Spot ETF Flows — August Delivers the Strongest Month of 2026
The most concrete bullish data point in the current Bitcoin setup comes from institutional demand — and August’s ETF flow data is not ambiguous.
According to SoSoValue monthly data, U.S. Bitcoin spot ETFs recorded the following net flow trajectory through 2026:
| Month | Net ETF Flow |
|---|---|
| May 2026 | -$2.43 billion |
| June 2026 | -$4.51 billion |
| July 2026 | +$172.43 million |
| August 2026 | +$3.52 billion |
The scale of the reversal is striking. Bitcoin ETFs went from -$4.51 billion in June — the worst monthly outflow of the year — to +$3.52 billion in August — the best monthly inflow of the year — in the span of two months. That is an approximately $8 billion swing in monthly institutional positioning in just 60 days.
Cumulative net inflows now sit near $54.85 billion, while total net assets have climbed back to approximately $99.61 billion — recovering a significant portion of the asset base that was eroded during the June–July outflow period.
What the ETF Flow Reversal Means
The timing of the August inflow reversal is not coincidental. As covered in our Bitcoin $2.99 billion liquidation and Trump White House summit analysis and Bitcoin 1,130-day SMA reclaim breakdown, August brought a convergence of macro catalysts — U.S. Treasury doubling long-end bond buybacks, Trump declaring “the war on crypto is over” at the White House, and $2.74 billion in short liquidations — that provided institutional investors with both a macro rationale and a technical entry point to re-enter Bitcoin through ETF vehicles.
The $3.52 billion in August inflows represents the institutional demand response to those catalysts — capital that came back into Bitcoin through regulated, institutional-grade instruments rather than spot markets alone. This is the structural demand signal that differentiates August’s recovery from the short-squeeze-driven bounces that characterized earlier 2026 price attempts.
As documented in our Bitcoin spot demand flashing bullish reversal with 87% win rate analysis and CryptoQuant declaring the Bitcoin bear cycle over, the on-chain and institutional demand picture that has been building through August is among the most constructive Bitcoin has produced in 2026. The ETF data adds the most direct institutional flow confirmation to that picture.
The October 2025 Fractal — A Caution Flag at the Exact Wrong Level
While the ETF flow data makes the bullish case with concrete numbers, analyst Mandelbrot (@Wild_Randomness) is highlighting a technical setup that demands equal analytical attention — and the reason it demands attention is the precision of where the fractal’s key level sits relative to Bitcoin’s current price.
The October 2025 Precedent
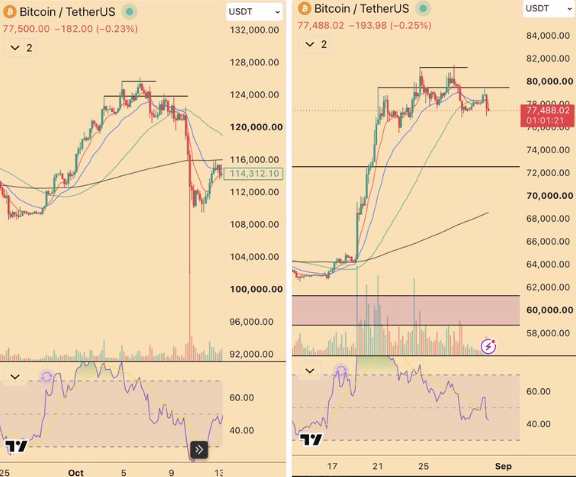
In October 2025, Bitcoin formed a head-and-shoulders-style structure beneath a local high after a strong upward thrust. The pattern produced a specific rejection zone — a “skyline” level — before triggering a sharp decline. That decline extended significantly from the rejection zone before finding its floor.
The October 2025 pattern is now being mapped onto Bitcoin’s current weekly structure — and the overlay produces a structurally similar setup at a critical moment.
The Current Fractal — Four Key Levels
The Skyline / Rejection Zone — $79,400–$79,500:
This is the level where Bitcoin has stalled in the current setup — sitting almost exactly at the equivalent rejection zone from the October 2025 structure. Bitcoin is currently trading at $79,155 — approximately $250–$350 below the skyline — having failed to push through this level cleanly on multiple attempts.
The precision of the stall at this level is what gives the fractal analytical weight. Bitcoin is not stalling near a round number or an arbitrary resistance — it is stalling at the specific level that the October 2025 fractal identifies as the rejection zone.
Bullish Invalidation — Close Above $79,500 and Reclaim of $81,500:
A sustained close above the $79,400–$79,500 skyline — followed by a reclaim of $81,500 — would break the fractal structure and invalidate the bearish comparison. This is the specific two-step condition that would confirm the October 2025 pattern is not playing out in 2026.
Bearish Trigger — Drop Below $76,800–$77,000:
A drop below the $76,800–$77,000 support zone would be the first technical confirmation that the fractal is playing out — indicating that the stall beneath the skyline has resolved to the downside rather than breaking higher.
Downside Fractal Target — ~$67,000:
If the fractal continues tracking the October 2025 template following a break below $76,800–$77,000, the projected downside target sits near $67,000 — representing approximately 15% downside from the current level.
The Tension — Strong ETF Demand vs. Technical Fractal Warning
The current Bitcoin setup presents a genuine analytical tension — not a situation where one side of the argument clearly dominates, but one where two credible and data-backed frameworks are pointing in different directions from the same price level.
The bullish case:
$3.52 billion in August ETF inflows — the strongest month of 2026 — represents the return of institutional demand at scale. CryptoQuant has declared the bear cycle over with a Bull Score of 80. The 1,130-day SMA has been reclaimed. On-chain spot demand is at its fastest monthly growth pace since December 2025. These are not sentiment indicators — they are measurable data points reflecting genuine capital flows and on-chain behavior.
The cautious case:
Bitcoin is stalling beneath $79,400–$79,500 — the precise skyline level that the October 2025 fractal identifies as the rejection zone. The head-and-shoulders-style structure that preceded October 2025’s sharp decline is visible on the current weekly chart. Until the skyline is cleared with a sustained close and $81,500 is reclaimed, the fractal’s bearish scenario remains structurally valid regardless of the ETF flow data.
The resolution:
Price will resolve the tension at one of the three key levels: a close above $79,500 (bullish invalidation begins), a hold between $77,000 and $79,500 (fractal still live, tension unresolved), or a break below $76,800 (bearish fractal triggered).
Bullish vs. Bearish Scenarios
Bullish Scenario
Bitcoin pushes through the $79,400–$79,500 skyline on a sustained daily or weekly close — invalidating the October 2025 fractal structure. A subsequent reclaim of $81,500 confirms the break is holding and that the October pattern has not repeated. In this scenario, the $3.52 billion in August ETF inflows, the CryptoQuant Bull Score at 80, and the 1,130-day SMA reclaim collectively define the framework — and Bitcoin’s path toward the $83,000 365-day MA confirmation level covered in our CryptoQuant bear cycle over analysis becomes the next structural test.
Bearish Scenario
Bitcoin fails to sustain above the skyline at $79,400–$79,500 and rolls over through the $76,800–$77,000 support zone. This break would confirm the October 2025 fractal is repeating — with the downside target near $67,000 as the projected floor. In this scenario, the August ETF inflow data remains constructive for the longer-term view, but the near-term chart structure takes precedence — and the $67,000 zone would represent a deeper retest of prior support before a renewed recovery attempt.
Bottom Line
Bitcoin is at the exact level where the October 2025 fractal and the August 2026 ETF demand story are in direct conflict — and the resolution of that conflict will be measured in daily and weekly closes rather than intraday price action.
The $3.52 billion in August ETF inflows is the strongest institutional demand signal of 2026 — a concrete data point that reflects genuine capital returning to Bitcoin through regulated vehicles. The October 2025 fractal is a specific and visually precise chart comparison that places a critical rejection zone at $79,400–$79,500 — almost exactly where Bitcoin is currently stalling.
Both are real. One will be wrong. The resolution is binary and the levels are specific:
Above $79,500 sustained → fractal invalidation begins → $81,500 is next.
Below $76,800 → fractal confirmed → $67,000 becomes the target.
Bitcoin is sitting right at the decision point.
Frequently Asked Questions
How much did Bitcoin ETFs record in August 2026 inflows?
U.S. Bitcoin spot ETFs recorded $3.52 billion in net inflows in August 2026 — the largest monthly total of 2026 per SoSoValue data. This reversed the -$4.51 billion in June outflows, with cumulative net inflows now near $54.85 billion and total net assets at approximately $99.61 billion.
What is the October 2025 fractal for Bitcoin?
Analyst @Wild_Randomness identified that Bitcoin’s current weekly structure closely mirrors the head-and-shoulders-style pattern that formed in October 2025 before a sharp decline. The fractal places a critical skyline resistance at $79,400–$79,500 — almost exactly where Bitcoin is currently stalling — with a bearish trigger at $76,800–$77,000 and a downside target near $67,000 if the pattern repeats.
The opinions and market insights shared on CoinsProbe represent the views of individual authors based on prevailing market conditions at the time of publication. Cryptocurrency investments carry significant risk and volatility. Readers are encouraged to conduct their own research and seek professional financial advice before making investment decisions. CoinsProbe and its contributors do not accept responsibility for financial losses or decisions made based on published content.
CoinsProbe may publish sponsored articles, affiliate links, or promotional collaborations. All sponsored material is clearly labeled to maintain transparency with our audience. Our editorial decisions remain fully independent, and advertising partnerships do not influence reviews, rankings, or published opinions.
Since 2023, CoinsProbe has delivered reliable insights on cryptocurrency, blockchain, and digital assets. Our content is created by experienced researchers and analysts who follow strict editorial standards focused on accuracy, transparency, and credibility. Every article is carefully reviewed and verified using trusted sources and current market data. We provide unbiased analysis and timely updates covering everything from emerging crypto projects to major industry developments.