

- BTC is trading near $63,788 as of August 12, 2026, up just 1.07% over 30 days — with a $1.28 trillion market cap reflecting subdued but stable price action.
- Futures demand is expanding while 30-day spot demand remains net negative — a divergence that has historically preceded rally failures rather than sustained advances.
- CryptoQuant's Alpha Library Indicator Heatmap shows multiple key metrics — including Thermocap Multiple, NVM Ratio, RSI Weekly, and Pi Cycle Top — all flashing BEAR simultaneously.
Bitcoin is holding ground near $63,788 — but the data beneath the price tells a more cautious story. While leveraged traders are actively adding exposure through futures markets, the organic spot demand that has historically underpinned durable Bitcoin rallies remains absent. And a sweeping look across CryptoQuant’s on-chain indicator suite confirms that the broader framework has not yet rotated from defensive to bullish.
At the time of writing, BTC is trading at approximately $63,788 with a market capitalization of $1.28 trillion. The 30-day gain of just +1.07% reflects a market that is consolidating rather than trending — and the on-chain picture explains why.

As covered in our Bitcoin macro bottom signals analysis and Bitcoin whale accumulation as retail sells breakdown, the constructive signals building in Bitcoin’s on-chain structure are real — but the broader indicator framework suggests those signals have not yet reached the critical mass needed to confirm a sustained directional move.
Futures Demand Rising — But Spot Demand Tells a Different Story
The most structurally important data point in the current Bitcoin setup comes from CryptoQuant founder Ki Young Ju, whose analysis of the 30-day sum of spot and perpetual futures demand growth reveals a clear and historically meaningful divergence.
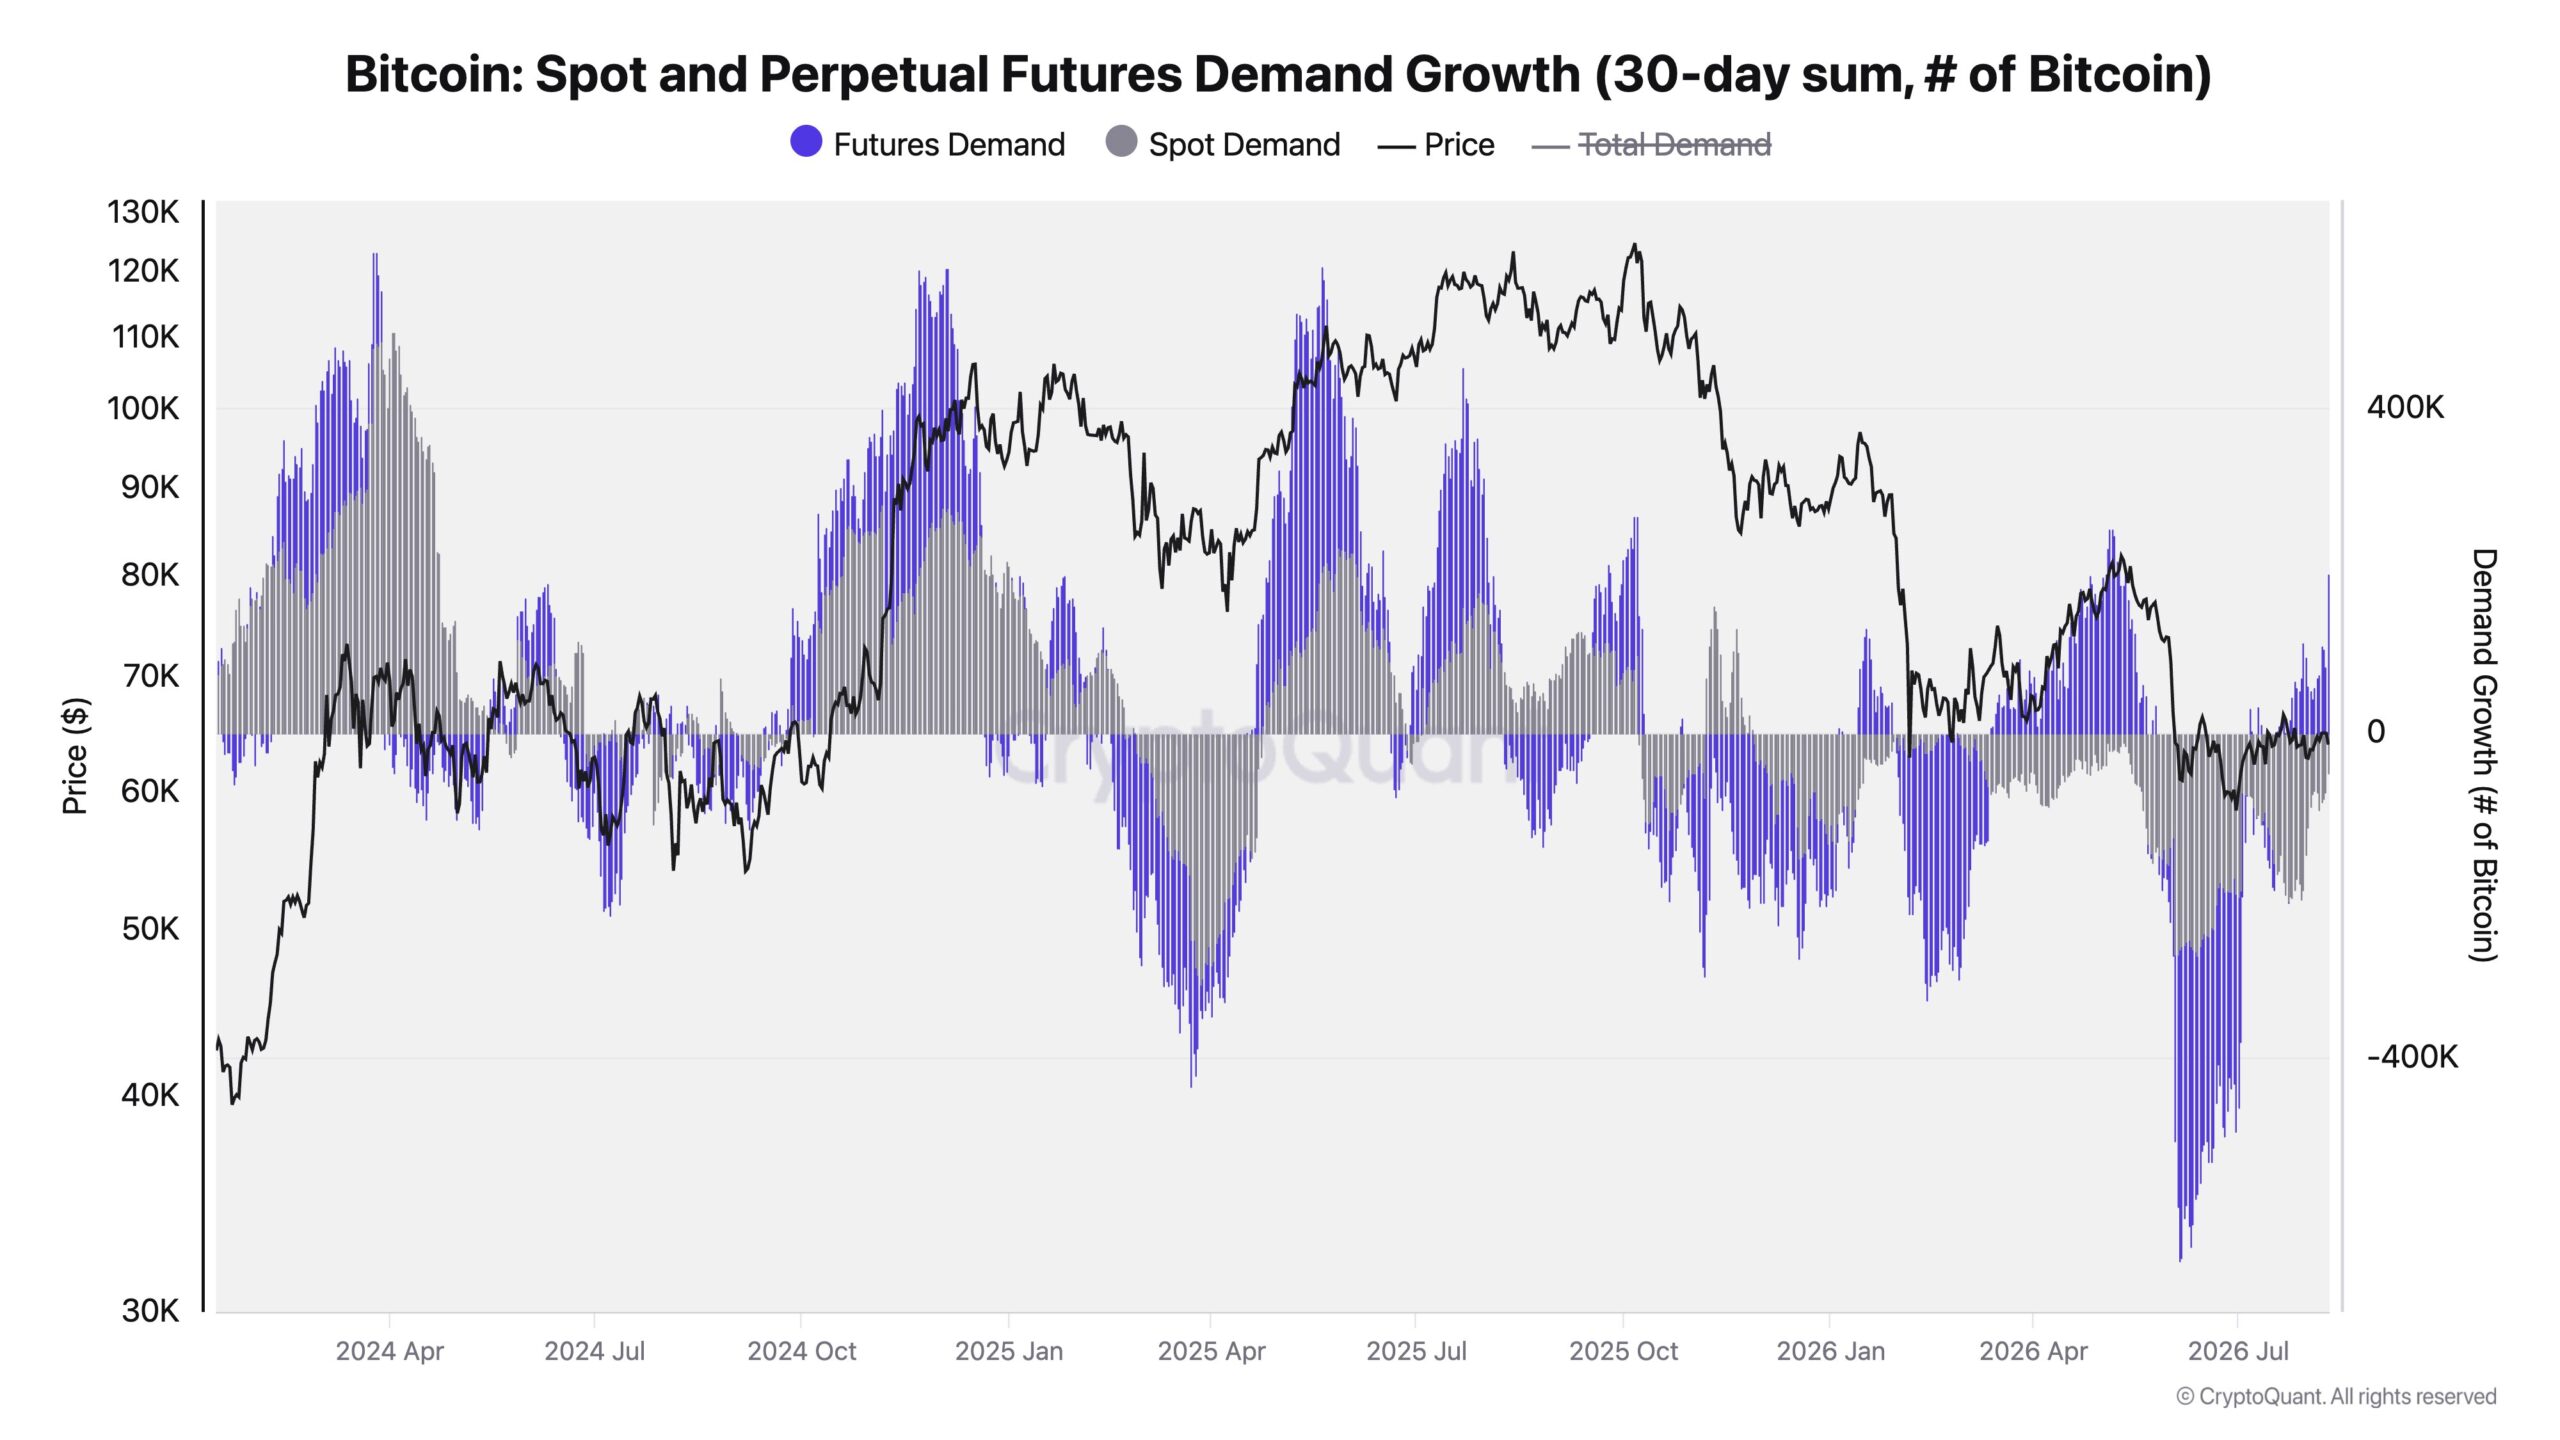
Futures demand (blue bars on the chart) is expanding — open interest is rising and leveraged traders are adding directional exposure. On its own, this looks like a bullish signal. But the other half of the picture undermines that interpretation significantly.
Spot demand (gray bars) remains net negative on a 30-day basis — meaning that organic, on-chain Bitcoin accumulation has not recovered to positive territory despite the futures activity. Real buyers acquiring and holding actual BTC are not showing up in numbers consistent with a durable price advance.
Why This Divergence Matters
The distinction between futures-led and spot-led price moves is one of the most reliable cycle filters in Bitcoin’s history. The pattern is well-established:
Futures-led advances without spot support tend to be fragile. They are driven by leveraged positioning rather than genuine demand for BTC as an asset — and when the leverage unwinds (whether through liquidations, profit-taking, or a macro catalyst), the price move reverses without the spot bid to catch it.
Spot-led advances with futures confirmation tend to be durable. They reflect actual accumulation — holders acquiring Bitcoin and removing it from circulation — which creates genuine supply pressure that sustains price at higher levels even after leveraged positions reduce.
The current reading — futures up, spot net negative — matches the pattern seen in earlier 2026 periods where price advances stalled and reversed. As documented in our Bitcoin realized profit vs. realized loss crossover analysis, the transition from a bearish to bullish demand structure requires more than derivatives activity — it requires the spot market to confirm the move.
Until spot demand crosses back into positive territory on a sustained 30-day basis, the current futures-driven consolidation near $64,000 carries meaningful reversion risk.
CryptoQuant BTC Indicator Heatmap — Stars Have Not Yet Aligned
The futures vs. spot divergence does not exist in isolation. A broader sweep across CryptoQuant’s Alpha Library Indicator Heatmap — which tracks Bitcoin’s condition across Valuation, Behavior, Liquidity, Technical, and Sentiment categories simultaneously — reinforces the same cautious conclusion.
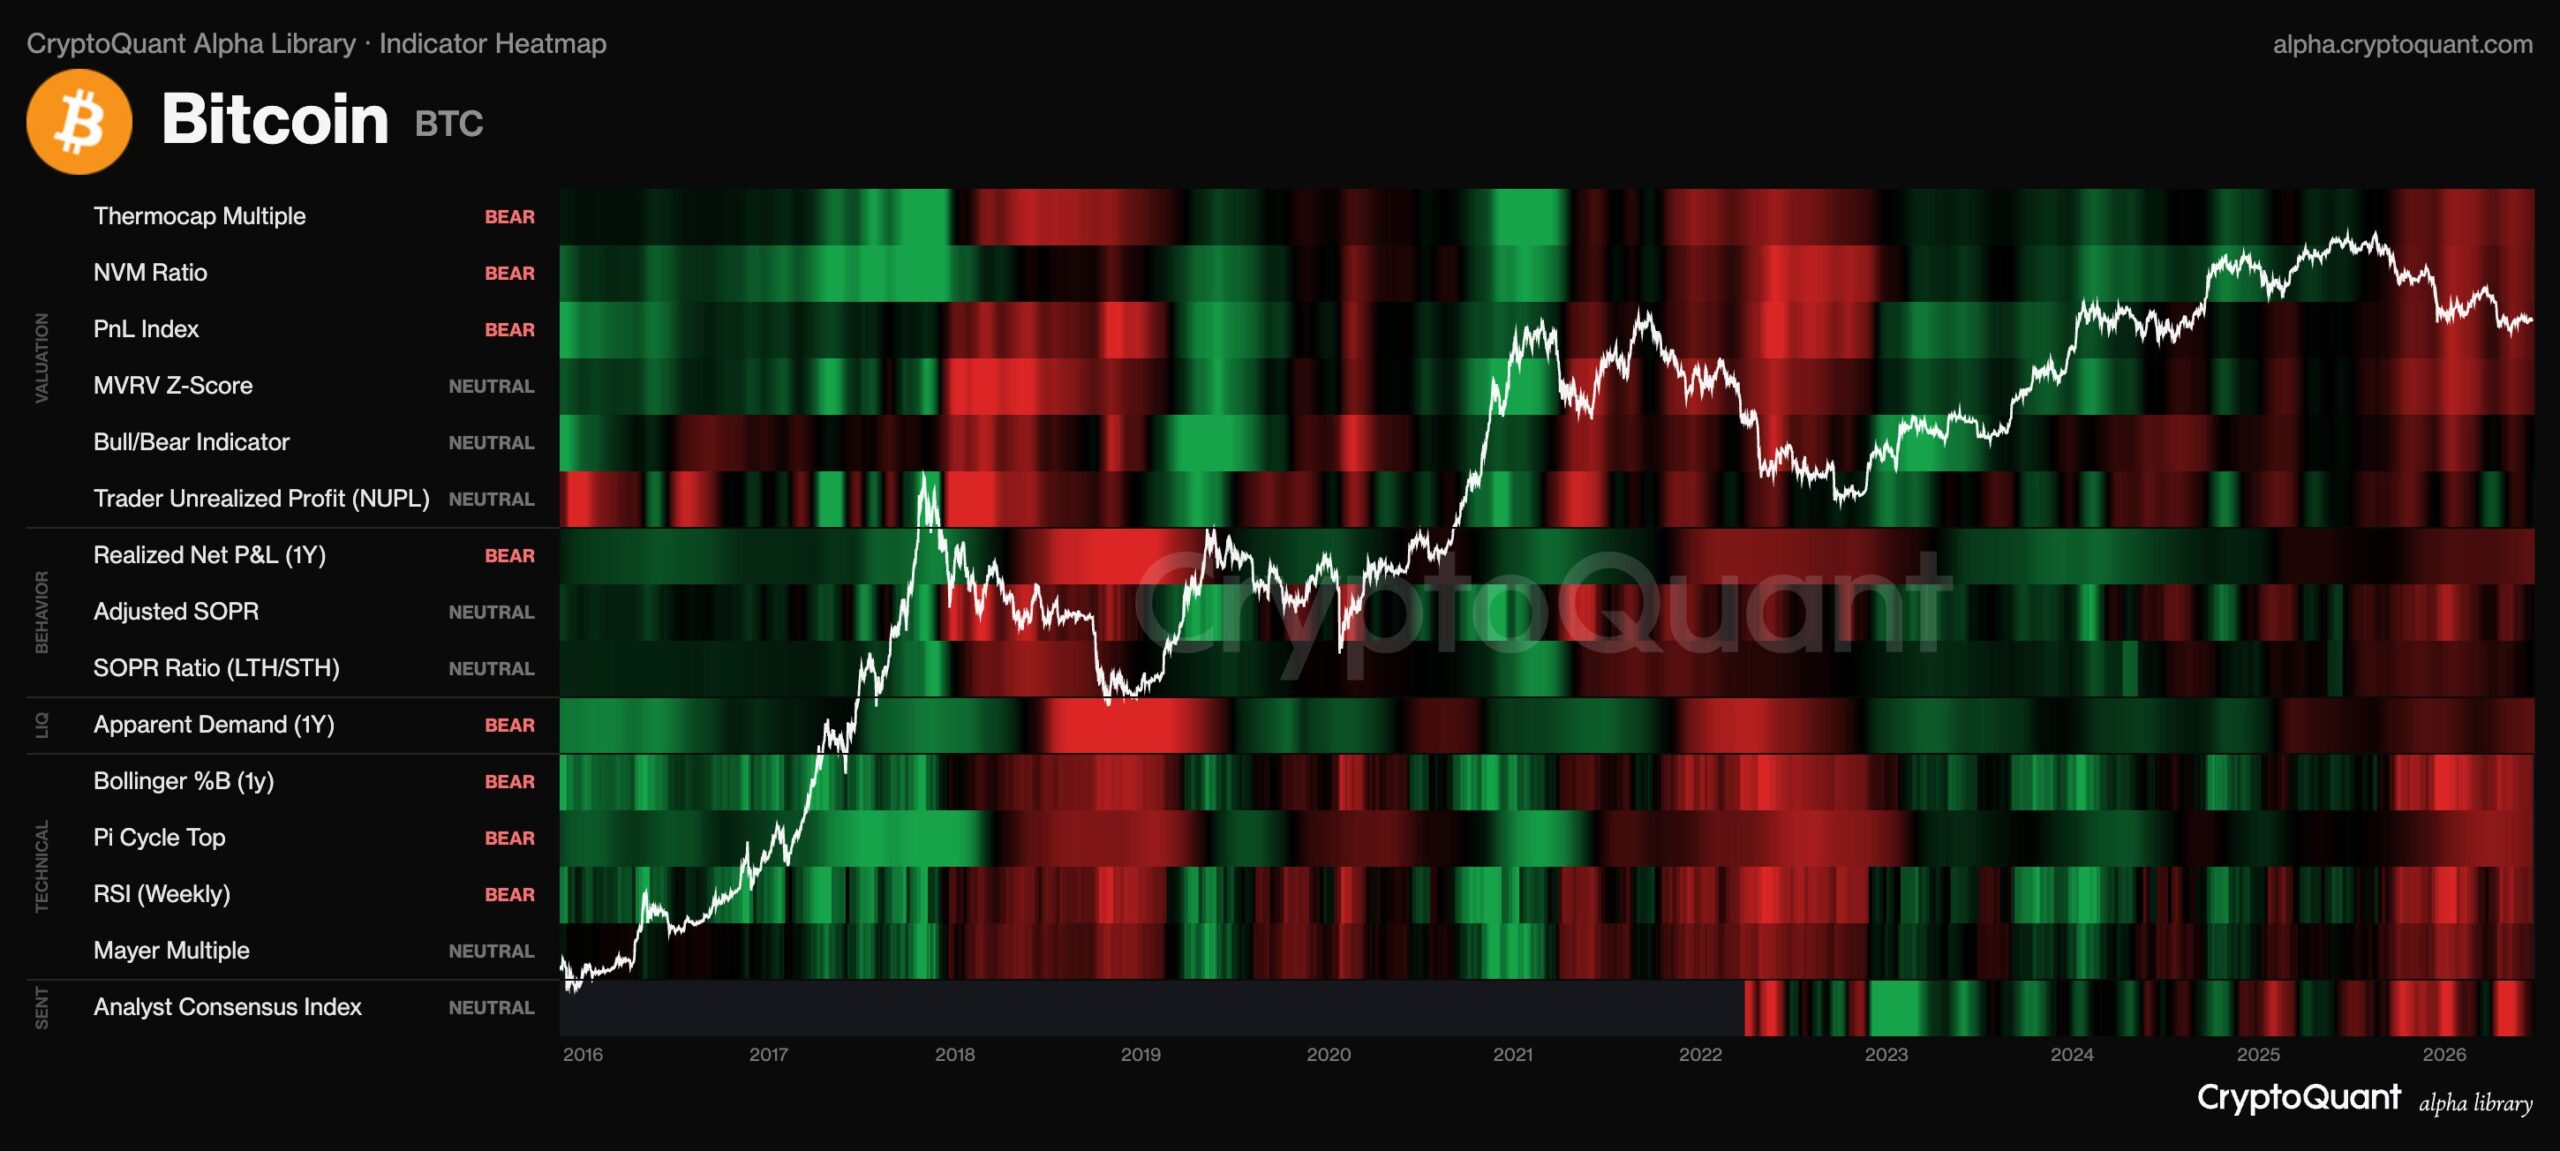
A broader view from CryptoQuant’s Alpha Library Indicator Heatmap reinforces the cautious stance. Multiple categories currently flash bearish signals:
- Valuation metrics such as Thermocap Multiple, NVM Ratio, and PnL Index are marked BEAR.
- Behavior indicators including Realized Net P&L (1Y) remain BEAR.
- Liquidity shows Apparent Demand (1Y) as BEAR.
- Technical signals such as Bollinger %B (1Y), Pi Cycle Top, and RSI (Weekly) are also BEAR.
- Several other metrics sit in NEUTRAL territory, with limited green (bullish) readings across the board.
The overall heatmap pattern indicates that the “stars have not yet aligned” for a sustained Bitcoin bull run. While price has held relatively steady near the $63,000–$64,000 zone, the underlying on-chain and valuation framework continues to lean defensive.
What Would Change the Picture
The current heatmap and demand structure are not permanent conditions — they are readings that have historically rotated from bearish to bullish as cycle dynamics shift. Understanding what needs to change provides a more actionable framework than simply noting the current bearish bias.
Spot demand crossing positive: The single most important near-term data point. A sustained 30-day spot demand turning net positive would signal that organic accumulation is resuming — the precondition for a futures-led advance to become a durable trend.
Valuation metrics rotating from BEAR to NEUTRAL/BULL: The Thermocap Multiple, NVM Ratio, and PnL Index have all shown the ability to rotate quickly during Bitcoin’s transitional phases. A rotation of even two of these three to neutral would materially shift the heatmap’s overall reading.
Weekly RSI reclaiming the midline: The weekly RSI transitioning from bearish to neutral territory is a condition that has historically accompanied Bitcoin’s early-stage recovery phases — before prices have moved significantly, but after the worst of the selling pressure has been absorbed.
As covered in our two independent Bitcoin models both pointing to undervaluation analysis, the valuation case for Bitcoin at current levels exists — but valuation alone does not produce price recovery without the demand and technical conditions to confirm it.
Bottom Line
Bitcoin is consolidating near $64,000 in a setup that is more nuanced than the price stability alone would suggest. Rising futures demand is providing a floor — but spot demand remaining net negative and a CryptoQuant heatmap showing BEAR readings across Valuation (Thermocap, NVM, PnL), Behavior (Realized Net P&L), Liquidity (Apparent Demand), and Technical (Bollinger %B, Pi Cycle Top, RSI Weekly) categories simultaneously paint a picture of a market where the conditions for a sustained advance have not yet fully materialized.
The price may be stable. The underlying framework is not yet aligned.
What to watch: Spot demand turning net positive on a 30-day basis is the single most important leading indicator that the current futures-driven consolidation is transitioning into something more durable. Until that rotation occurs — confirmed by corresponding shifts in the CryptoQuant heatmap from BEAR to NEUTRAL or BULL across key metrics — the $63,000–$64,000 range is more accurately described as a holding pattern than the early stages of a sustained recovery.
Frequently Asked Questions
Why is Bitcoin’s futures demand rising but spot demand negative?
Open interest in Bitcoin perpetual futures is expanding — meaning leveraged traders are adding exposure — while on-chain spot demand remains net negative on a 30-day basis. This divergence indicates that the current price stability near $64,000 is being sustained by derivatives activity rather than genuine organic accumulation, which has historically made advances more fragile and prone to reversal.
What does the CryptoQuant Indicator Heatmap show for Bitcoin?
The CryptoQuant Alpha Library Heatmap currently shows multiple BEAR readings across Valuation (Thermocap Multiple, NVM Ratio, PnL Index), Behavior (Realized Net P&L 1Y), Liquidity (Apparent Demand 1Y), and Technical (Bollinger %B, Pi Cycle Top, RSI Weekly) categories — with most remaining metrics in NEUTRAL. The overall reading suggests the conditions for a sustained Bitcoin bull run have not yet aligned.
What would confirm a genuine Bitcoin recovery from current levels?
Three key rotations would signal a genuine shift: spot demand crossing net positive on a 30-day basis, valuation metrics (Thermocap, NVM, PnL) rotating from BEAR to NEUTRAL, and the weekly RSI reclaiming the midline. Together, these would indicate that organic accumulation is resuming and the broader indicator suite is transitioning from defensive to constructive.
The opinions and market insights shared on CoinsProbe represent the views of individual authors based on prevailing market conditions at the time of publication. Cryptocurrency investments carry significant risk and volatility. Readers are encouraged to conduct their own research and seek professional financial advice before making investment decisions. CoinsProbe and its contributors do not accept responsibility for financial losses or decisions made based on published content.
CoinsProbe may publish sponsored articles, affiliate links, or promotional collaborations. All sponsored material is clearly labeled to maintain transparency with our audience. Our editorial decisions remain fully independent, and advertising partnerships do not influence reviews, rankings, or published opinions.
Since 2023, CoinsProbe has delivered reliable insights on cryptocurrency, blockchain, and digital assets. Our content is created by experienced researchers and analysts who follow strict editorial standards focused on accuracy, transparency, and credibility. Every article is carefully reviewed and verified using trusted sources and current market data. We provide unbiased analysis and timely updates covering everything from emerging crypto projects to major industry developments.