
- Solana spot ETFs saw $8.8M in inflows, the strongest daily reading in three months.
- SOL’s 2026 price structure mirrors its 2023 bottoming pattern, while network fundamentals continue improving.
- $60-$70 support is key for the base-building thesis, with major infrastructure upgrades progressing.
Solana has been one of the quieter major assets through much of 2026 — down 39.27% year-to-date and consolidating in a range that has tested the patience of even committed holders. But two developments are now beginning to shift the narrative: institutional capital is returning in a measurable way, and the price chart is drawing comparisons to the exact structure that preceded SOL’s most powerful recovery in recent history.
At the time of writing, SOL is trading at approximately $75.59 with a market capitalization of $44.03 billion. The 24-hour and 30-day price action remain slightly negative — but the data beneath the surface tells a more constructive story.

Solana ETF Inflows Hit 3-Month High — Institutions Are Returning
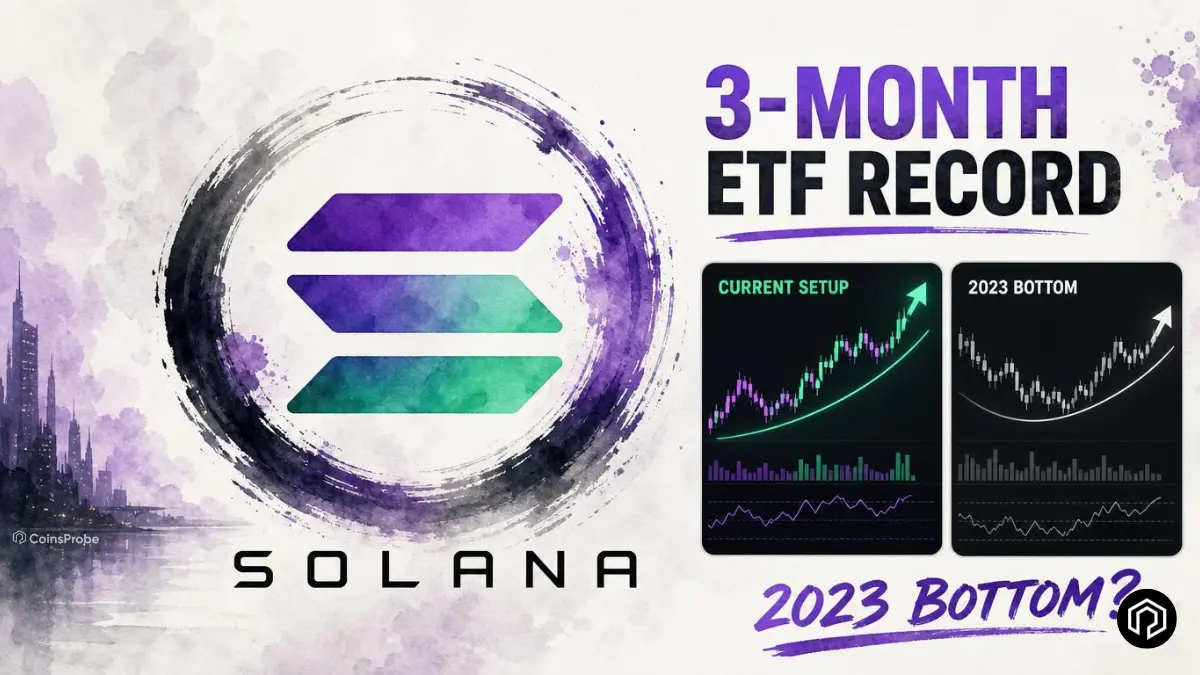
The most immediately significant data point for Solana this week comes from Santiment, which shows Solana spot ETFs recording $8.8 million in net inflows in a single day — the largest daily inflow figure since May 12 and the strongest reading in the past three months.
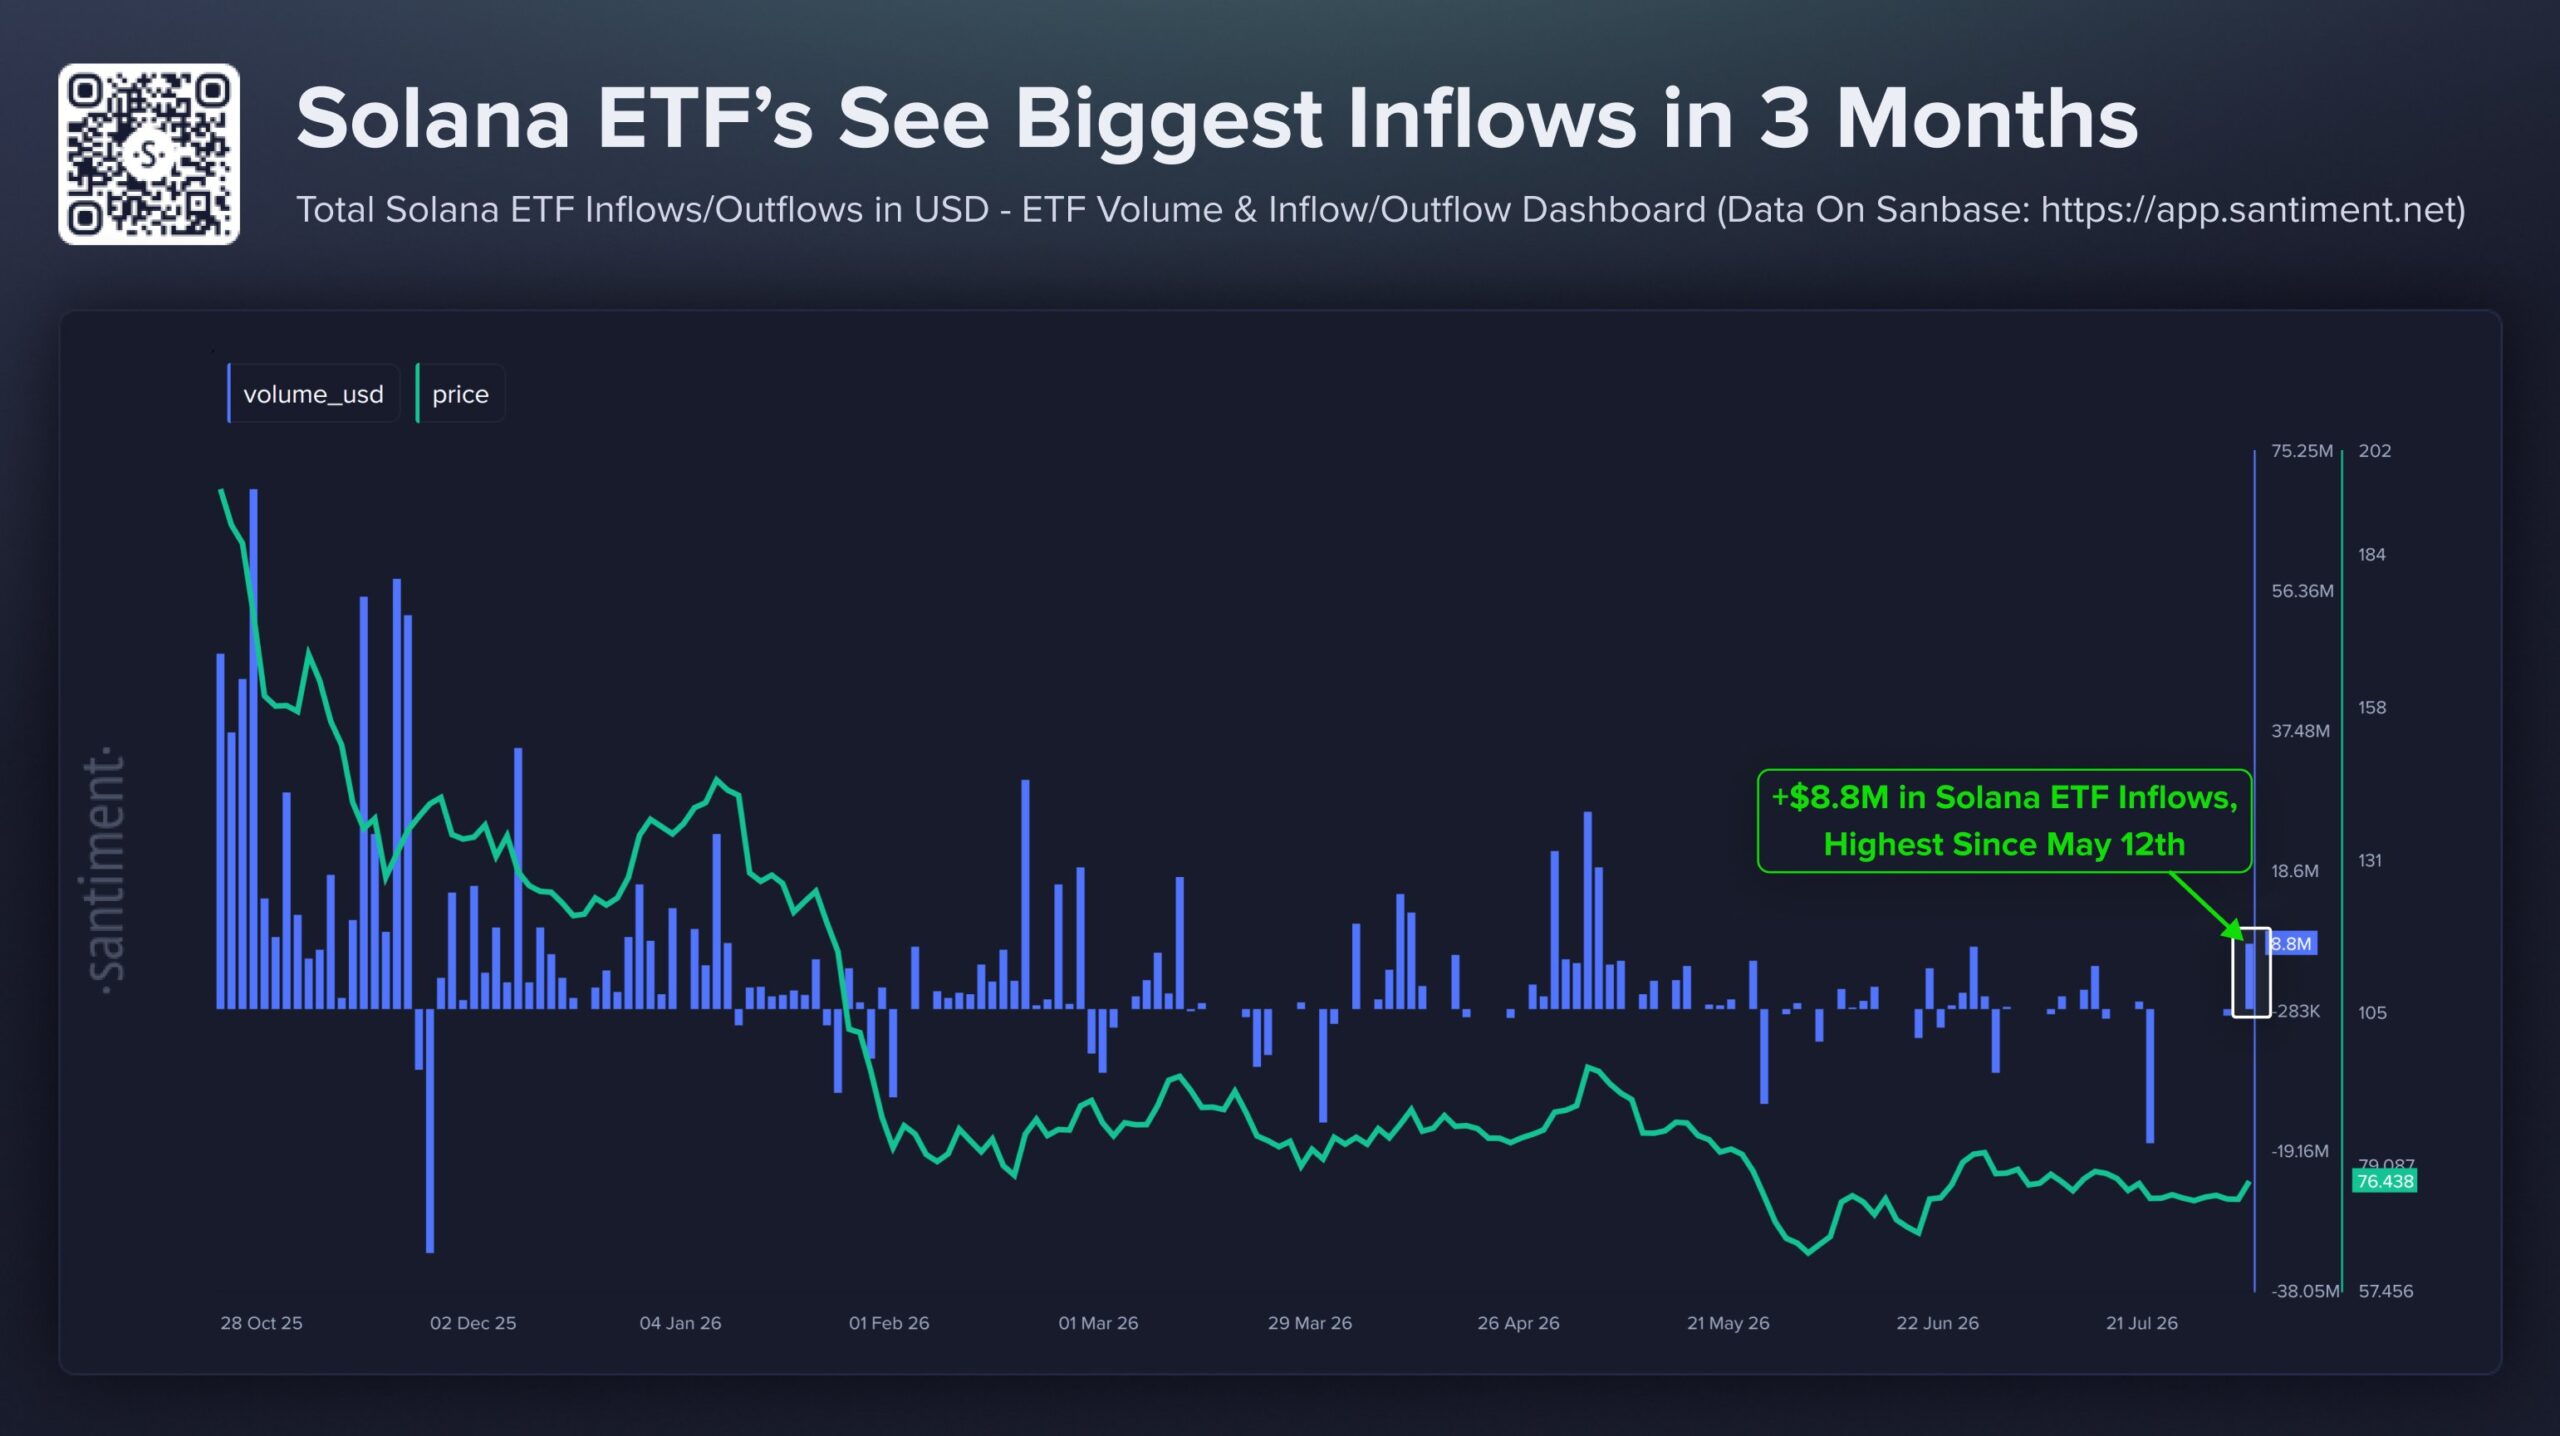
That context matters. The period between May 12 and now has been characterized by quiet to negative ETF flow dynamics for Solana — a persistent trickle of indifference from traditional capital that has been a contributing factor to the subdued price action. A single-day reading of $8.8 million does not reverse that trend by itself, but it does represent a clear and measurable break from the recent flow environment.
Institutional capital does not typically make abrupt directional shifts without underlying reasoning. When the largest daily ETF inflow in three months arrives while price is still consolidating near year-to-date lows, the most natural interpretation is that traditional market participants are beginning to position ahead of an anticipated move rather than chasing one already underway. That behavioral pattern — buying quietly into weakness rather than into strength — is the same dynamic documented in our Bitcoin whale accumulation analysis and is one of the most consistently constructive on-chain and flow signals across crypto assets.
Network Fundamentals Are Strengthening in the Background
The ETF inflow data does not exist in a vacuum. Solana’s underlying network metrics have been quietly improving across multiple dimensions — providing the kind of fundamental backdrop that gives institutional allocators confidence in adding exposure during price weakness.
Real-World Asset (RWA) value on Solana has been reaching new milestones, reflecting the network’s growing role as infrastructure for tokenized traditional assets. As covered in our SBI and DigiiFT JX On-Chain launch analysis, Solana is now hosting Japan’s first blockchain-based equity strategy — a development that illustrates how institutional adoption of Solana rails is extending beyond the domestic U.S. market into Asia’s traditional finance sector.
Additional network developments reinforcing the fundamental picture:
Stablecoin supply on Solana continues to grow — a reliable proxy for genuine economic activity on the network, as stablecoin deployment reflects real usage demand rather than speculative token flows.
Tokenized equity volume has reached meaningful milestones, with xStocks — Solana’s tokenized equity access layer — expanding its reach and bringing traditional equity exposure onto Solana rails for a broader global audience.
Perpetual futures activity has also been hitting significant levels, reflecting deepening DeFi liquidity and derivatives infrastructure on the network.
Infrastructure upgrades are progressing on multiple fronts simultaneously:
- Alpenglow — targeting approximately 150ms finality, which would make Solana’s transaction settlement speed competitive with — or superior to — many traditional financial infrastructure systems
- Agave 4.2 — moving toward mainnet adoption in August, bringing validator client improvements that strengthen network stability and performance
- xStocks expansion — broadening tokenized equity access across Solana rails to new markets and asset classes
These developments collectively describe a network that is building genuine utility and institutional-grade infrastructure even while its token price has been consolidating — a divergence that historically resolves in favor of the network’s fundamental trajectory.
2026 Price Structure Echoes the 2023 Bottoming Phase
Beyond the flow data and network fundamentals, the technical picture is producing one of the more striking pattern comparisons in the current crypto market — one that, as covered in our SOL 2023 bottom fractal analysis, every Solana holder should be paying close attention to.
What the 2023 Bottom Looked Like
In 2023, Solana carved out a multi-month base structure characterized by:
- Successive lower lows that appeared to confirm continued bearish momentum
- An extended period of low volatility and community disinterest during which price compressed into a tight range
- A gradual base-building phase near the $40 region before the rally that eventually took SOL to significantly higher levels
- A powerful recovery rally that followed the completion of the base — one of the strongest percentage advances among major crypto assets in that cycle
The traders who bought the 2023 lows near $40 and sold into the subsequent strength generated some of the best risk-adjusted returns in that market cycle. Many of those same market participants are now monitoring the 2026 structure closely — because the chart is producing a comparable formation.
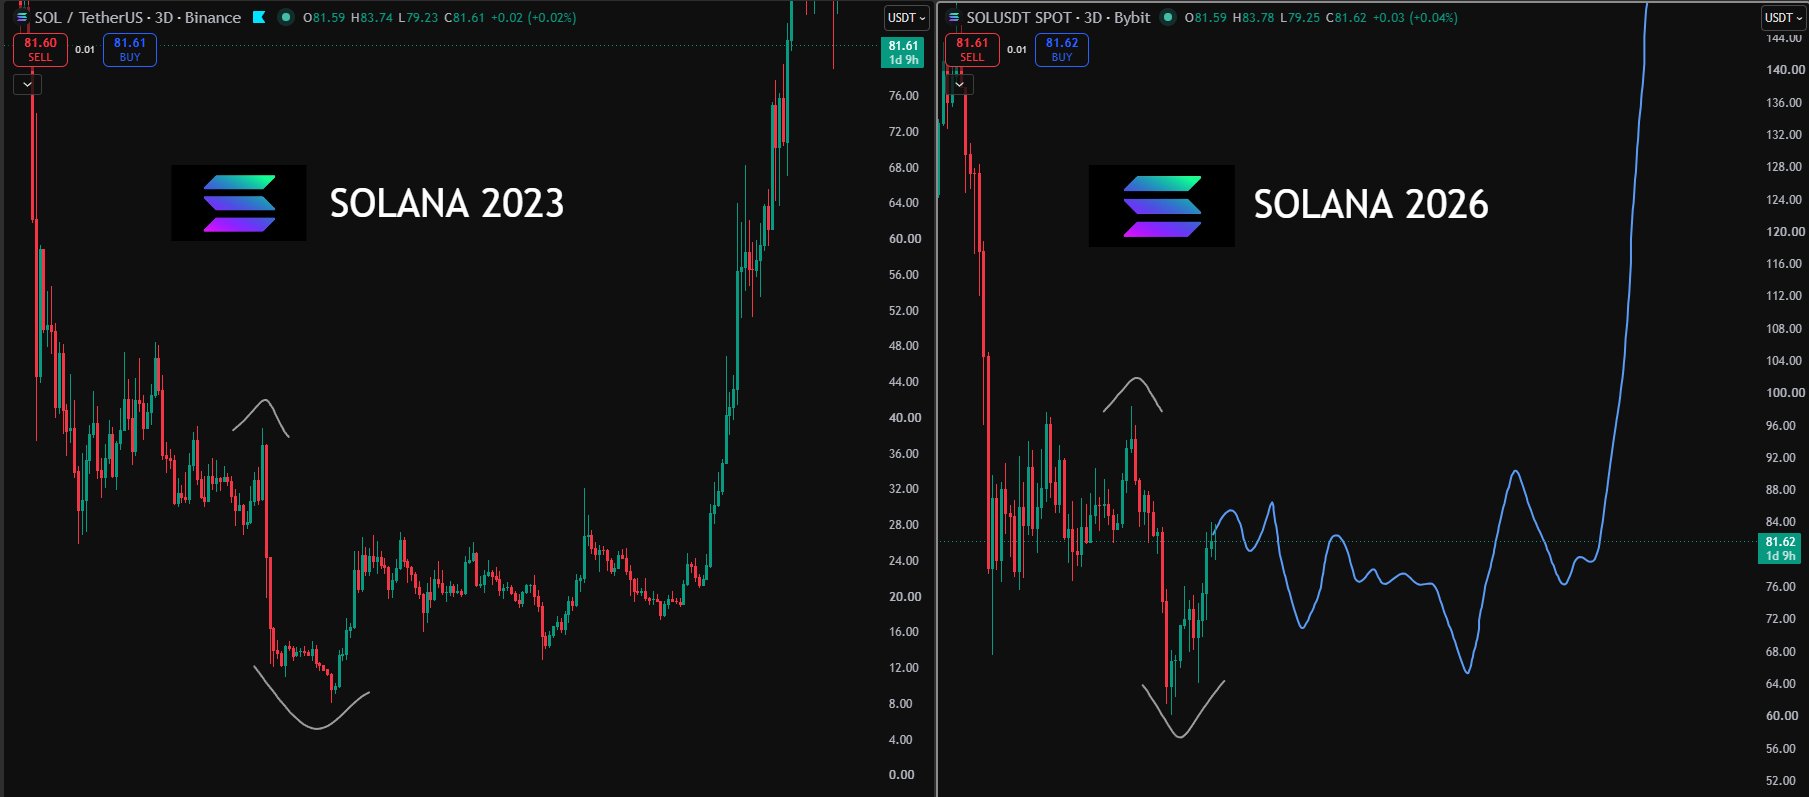
How 2026 Rhymes With 2023
The current SOL chart is displaying a base-building structure that shares several key characteristics with the 2023 bottoming phase:
- Extended decline from previous highs — the 39.27% year-to-date drawdown has created the same type of extended corrective backdrop that defined the pre-recovery period in 2023
- Successive tests of key support — the $60-$70 zone is being tested repeatedly in a manner consistent with the final phases of a base-building process
- Low sentiment and subdued price action — the quiet consolidation environment of recent months mirrors the disinterest phase that preceded the 2023 breakout
- Improving fundamentals in the background — just as in 2023, the network metrics are strengthening while the token price remains compressed
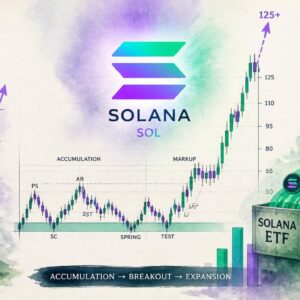
The fractal comparison does not guarantee a replay of the 2023 outcome. But the structural similarity — combined with the simultaneous appearance of the strongest ETF inflows in three months — creates a more compelling setup than the year-to-date price performance alone would suggest.
Bullish vs. Bearish Scenarios
Bullish Scenario
SOL holds the $60-$70s support zone on a sustained basis, continues building the base structure that mirrors the 2023 bottoming phase, and ETF inflows sustain or accelerate from the $8.8 million single-day reading. In this scenario, institutional accumulation during price weakness positions traditional capital for an entry into the early stages of a recovery — and the 2023 fractal begins to play out with a gradual but accelerating move toward higher resistance levels. A sustained close above $98 would serve as the first meaningful confirmation that the base is transitioning into recovery.
Bearish Scenario
SOL loses the $60-$70 support on a sustained daily or weekly close, breaking the base structure and invalidating the 2023 fractal comparison. In this scenario, lower support levels — potentially in the $45 range — come into focus, and the ETF inflow data proves to be a single-day anomaly rather than the beginning of a sustained institutional accumulation trend. The fundamental network improvements remain intact regardless, but the technical recovery timeline extends significantly.
Bottom Line
Solana is presenting a setup that requires looking beyond the surface-level year-to-date decline to understand what is actually developing. The strongest ETF inflows in three months arriving while price consolidates near lows is the behavioral signature of institutional accumulation — not retail momentum chasing. The 2023 bottom fractal appearing in the current chart structure provides a historical template for how this kind of base-building phase has resolved before for SOL specifically. And the network fundamentals — RWA growth, stablecoin supply expansion, xStocks tokenized equity, and infrastructure upgrades including Alpenglow and Agave 4.2 — describe a network that is building genuine utility regardless of short-term token price dynamics.
The mid-$70s support zone is the immediate level that must hold for the base-building thesis to remain intact. A sustained close above $98 would begin to confirm that the fractal comparison is playing out — and that the institutional capital now re-entering through ETFs is positioned correctly ahead of Solana’s next directional move.
Frequently Asked Questions
Will Solana recover in 2026?
SOL is trading near $75.59 after a 39% year-to-date decline, but the strongest ETF inflows in three months and a chart pattern resembling the 2023 bottom suggest a potential recovery phase may be developing.
Is Solana a good investment in August 2026?
Solana currently shows improving institutional interest through ETF inflows and a technical structure similar to its 2023 bottom. It remains a high-volatility asset best suited for risk-tolerant investors.
What caused the recent Solana ETF inflows?
Solana spot ETFs recorded $8.8 million in net inflows in a single day — the largest since May 12 — signaling renewed institutional demand after several quiet months.
Is Solana forming a bottom like in 2023?
The 2026 price chart is displaying a multi-month base-building structure that closely resembles the bottoming pattern Solana formed in 2023 before its major rally.
Should I buy Solana now?
Recent low near $60 align with the strongest ETF inflows in three months and a developing 2023-style bottom. Risk-tolerant traders may see opportunity, while others may wait for clearer confirmation of a breakout.
The opinions and market insights shared on CoinsProbe represent the views of individual authors based on prevailing market conditions at the time of publication. Cryptocurrency investments carry significant risk and volatility. Readers are encouraged to conduct their own research and seek professional financial advice before making investment decisions. CoinsProbe and its contributors do not accept responsibility for financial losses or decisions made based on published content.
CoinsProbe may publish sponsored articles, affiliate links, or promotional collaborations. All sponsored material is clearly labeled to maintain transparency with our audience. Our editorial decisions remain fully independent, and advertising partnerships do not influence reviews, rankings, or published opinions.
Since 2023, CoinsProbe has delivered reliable insights on cryptocurrency, blockchain, and digital assets. Our content is created by experienced researchers and analysts who follow strict editorial standards focused on accuracy, transparency, and credibility. Every article is carefully reviewed and verified using trusted sources and current market data. We provide unbiased analysis and timely updates covering everything from emerging crypto projects to major industry developments.