
- Lorenzo Protocol ($BANK) is trading at $0.2454, up 112.87% in 24 hours and 495.25% over 7 days, with a $187.74M market cap.
- Trader @Ryker_Crypto called $BANK at a $14M market cap in April, with the token now up 500%+ since then.
- $BANK's chart is drawing comparisons to $RAVE's breakout fractal, fueling speculation of further upside.
- As a small-cap token, $BANK remains highly volatile, with significant upside potential but equally high downside risk.
Lorenzo Protocol’s token $BANK has delivered one of the most violent moves in the current market. As of July 20, 2026, it trades at $0.2454, surging +112.87% in the last 24 hours and an eye-watering +495.25% over the past 7 days. 24-hour trading volume has exploded to $441.16 million, pushing the market cap to approximately $187.74 million.
This type of extreme short-term volatility is becoming a familiar pattern among small-cap tokens. Similar explosive runs followed by sharp corrections have been seen in names like Memecore (M), Audiara (BEAT), Rave, and Velvet. $BANK now appears to be traveling on the same track of high-volatility pump-and-dump behavior.

The Early Call — Trader Flagged $BANK at $14M Cap
Before the explosive move — before the $441M daily volume and the five-bagger weekly candle — trader @Ryker_Crypto made a public, documented call on $BANK in late April 2026, when its market cap sat at approximately $14 million.
His thesis at the time: $BANK was “the next $RAVE” — drawing a direct comparison to $RAVE’s prior explosive trajectory. He specifically highlighted the absence of unlock sell pressure as a structural advantage — meaning the token’s float would not be continuously diluted by insider or team selling as it rallied — and encouraged the community to position ahead of the move.
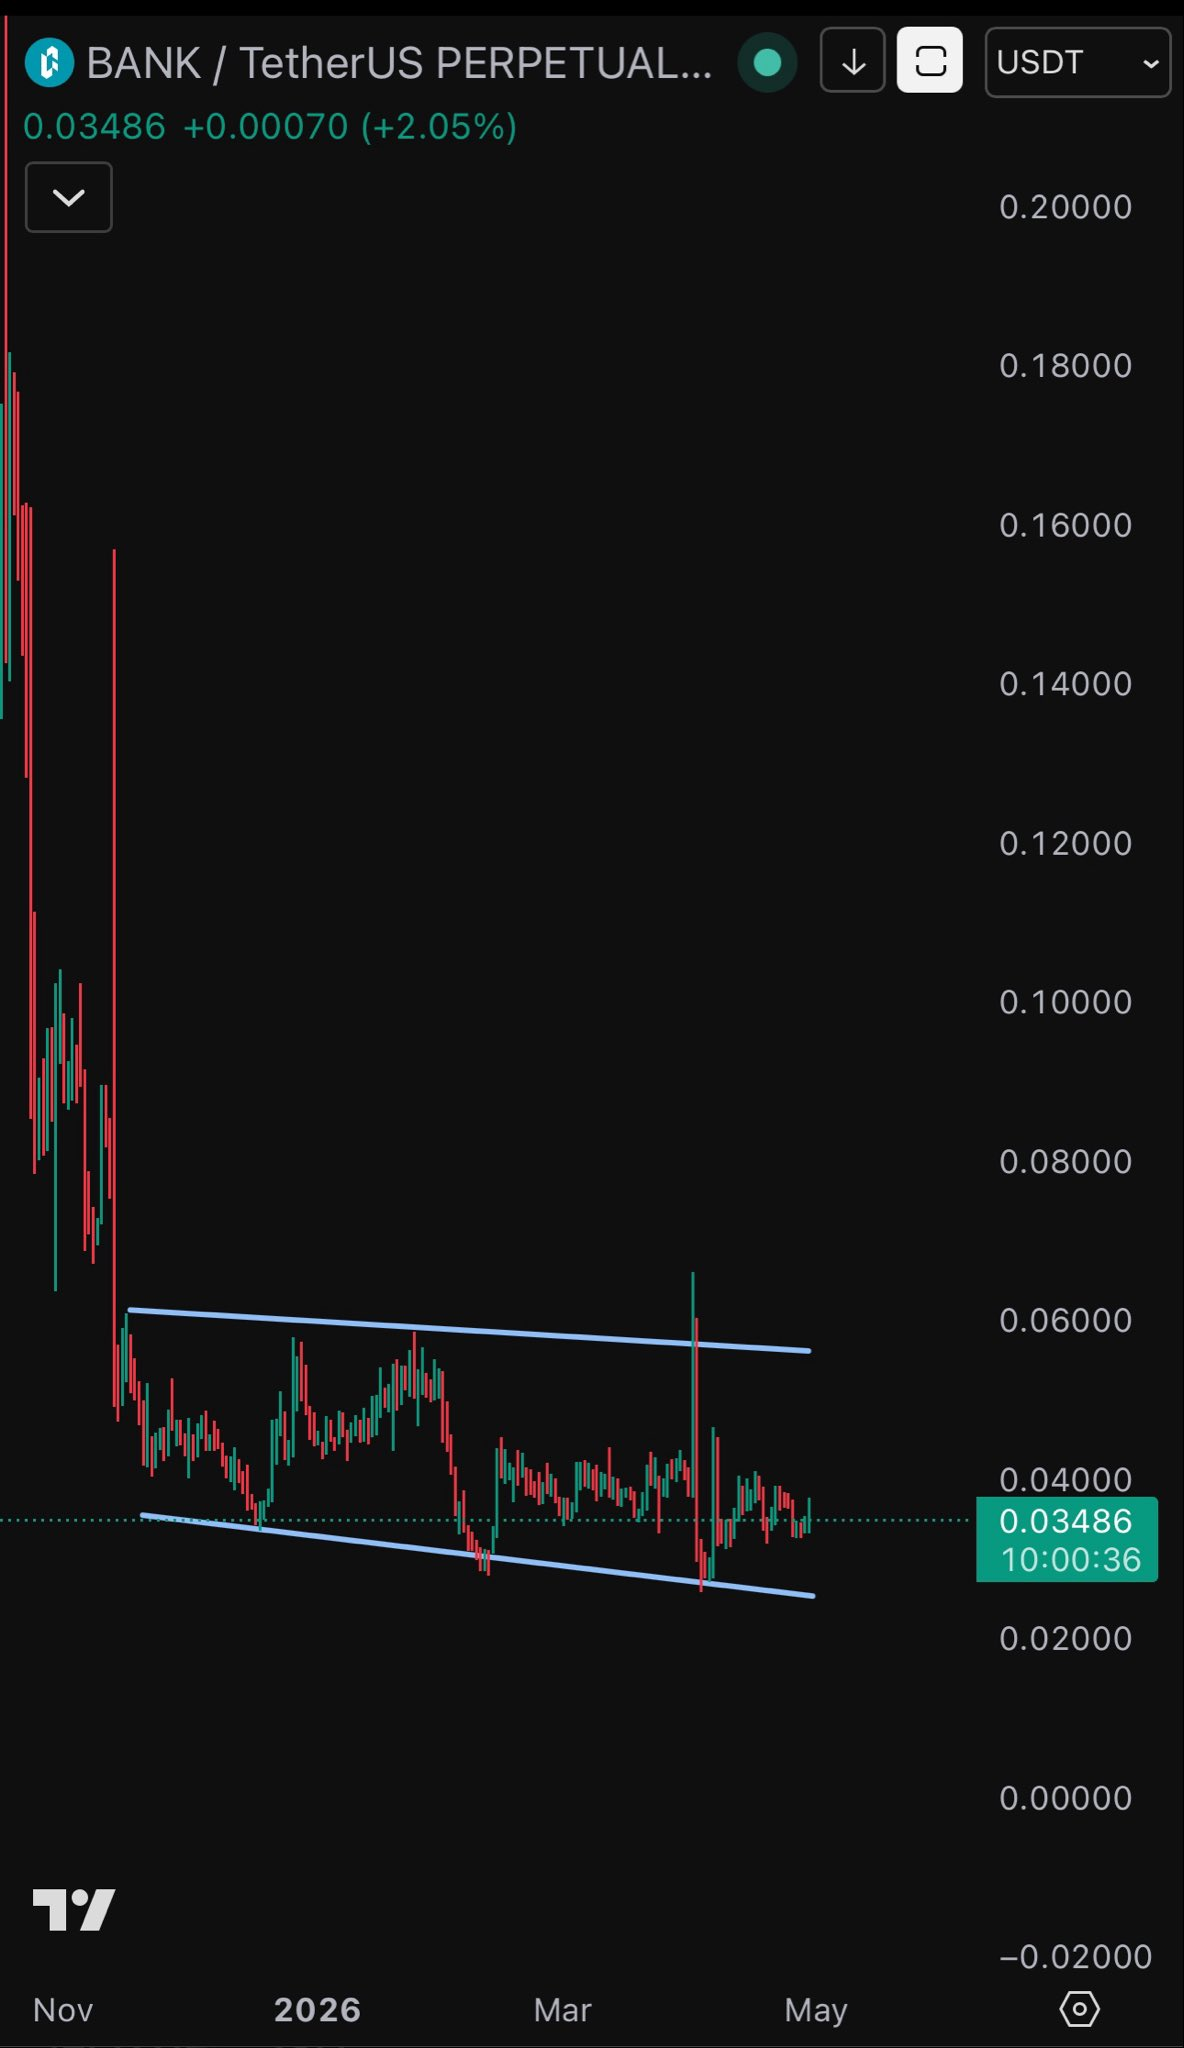
From that ~$14 million market cap entry point to today’s $187.74 million — the call has produced +500%+ gains for those who positioned early. This kind of early conviction thesis, made before visible momentum rather than in response to it, is what distinguishes informed small-cap positioning from FOMO-driven chasing.
The $RAVE vs $BANK Fractal — The Bullish Case
The fractal comparison at the centre of the current $BANK thesis maps two specific price structures against each other — and the parallel is detailed enough to warrant a careful examination of both what it shows and what it does not guarantee.
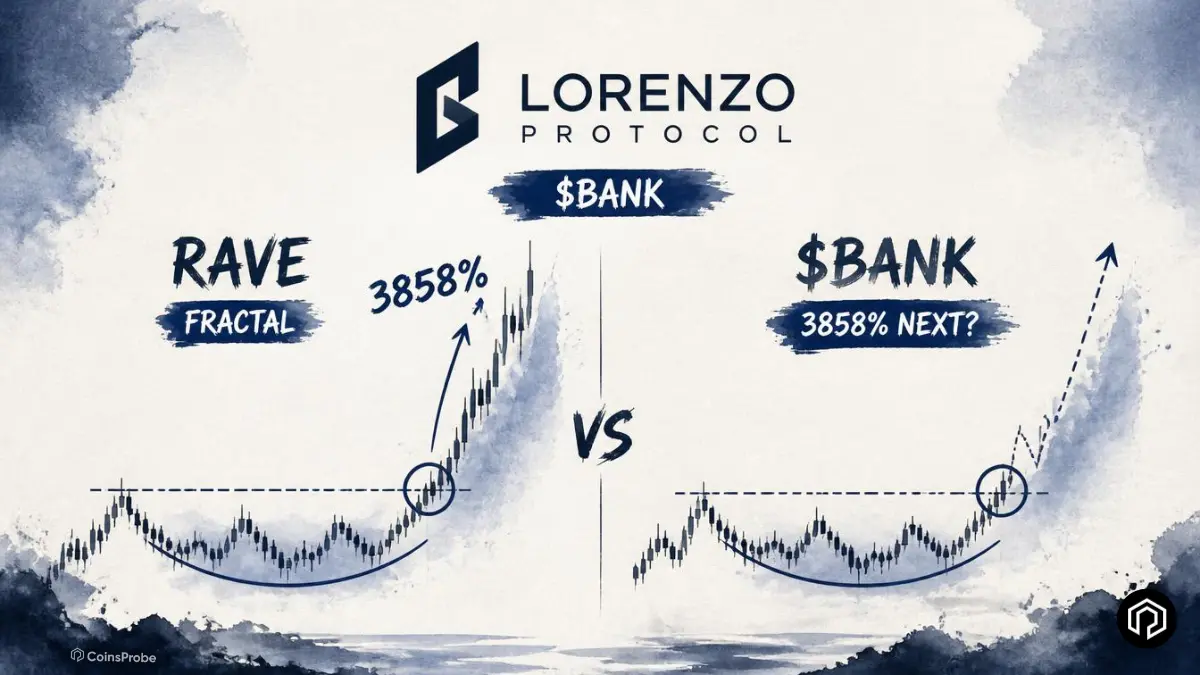
$RAVE’s structure (left chart):
$RAVE experienced a ~70.92% correction from its range high near $0.72 — a deep but not unusual drawdown for a small-cap token in a challenging market environment.
Following that correction, $RAVE formed a clear bottom, consolidated, and then broke out above the $0.72 range high — the level that had previously acted as resistance.
What followed the breakout: a +3,858% rally taking price from approximately $0.72 all the way to an all-time high above $28.73 — one of the most extraordinary single-token moves in the recent small-cap narrative cycle.
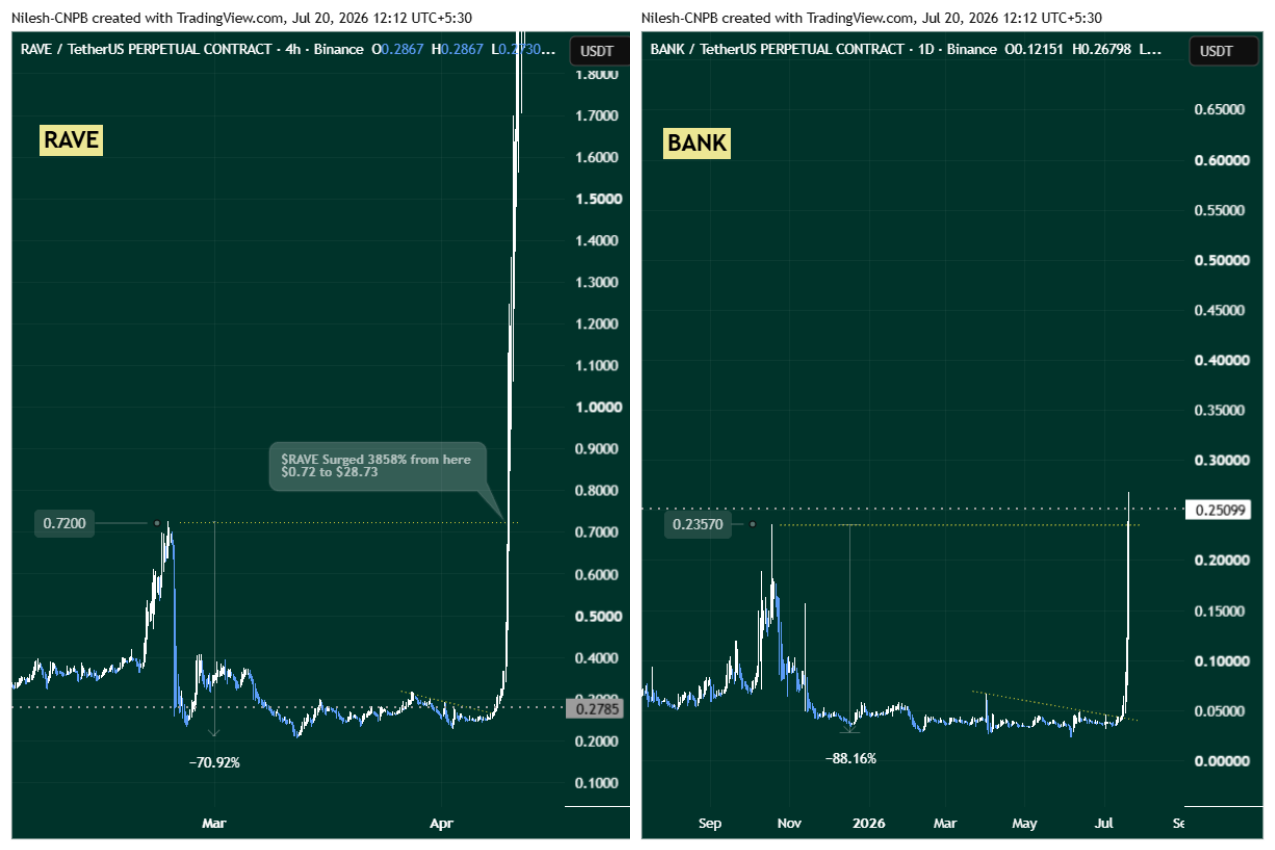
$BANK’s current structure (right chart):
$BANK suffered an even deeper correction than $RAVE — approximately -88.16% from its own range high of $0.2357. This deeper correction is actually a double-edged data point: more painful for holders who experienced it, but also potentially creating a more compressed and energetic base for the subsequent move.
The key development: $BANK has recently reclaimed the $0.2357 level — the range high that had previously acted as resistance throughout the corrective phase. This reclaim is the structural event that mirrors RAVE’s breakout above its own range high, and it is the specific trigger that has the fractal thesis active right now.
The $0.2357 level — now flipped from resistance to support — is the structural foundation of the bullish case. As long as price holds above it, the parallel to RAVE’s post-correction breakout phase remains intact.
The Warning — Why Fractals Cut Both Ways
This is where the analysis requires equal emphasis on the risk side. The same fractal framework that produces the bullish $RAVE comparison for $BANK is the framework that has also flagged significant downside risk for other tokens in the current cycle — and not all of those warnings have been wrong.
As we documented in our DEXE 1,000% YTD CRO fractal article — DeXe’s extraordinary +1,005% YTD performance is accompanied by a CRO fractal warning of a potential 90% correction from its fakeout high. In our Audiera BEAT symmetrical triangle warning — BEAT showed the same pre-collapse pattern as LAB Token before its 75% crash. And in our Zcash ZEC XRP fractal article — ZEC’s structural parallel to XRP’s 2021–2022 collapse path has been tracking with notable precision.
The lesson across all three: fractal setups are pattern-recognition tools, not guarantees. The $RAVE parallel makes the $BANK bullish case compelling — but market conditions, liquidity depth, macro sentiment, and token-specific unlock schedules can all diverge from the prior pattern and produce an entirely different outcome.
For $BANK specifically — a token that has already delivered +495% in a single week — the risk of a sharp mean-reversion from any profit-taking wave is elevated precisely because so many participants are now sitting on significant unrealised gains. The same concentrated capital that drove the rally can exit just as quickly.
Risk Management — Non-Negotiable at These Levels
Given $BANK’s current volatility profile — +112% in a single day, $441M in 24-hour volume, a market cap that went from $14M to $187M in weeks — standard risk management principles become especially important:
Never invest more than you can afford to lose entirely. Small-cap tokens with this volatility profile can lose 70–90% as quickly as they gained it.
Position sizing matters more than entry timing. A correctly sized position in $BANK can be held through volatility without causing catastrophic loss — an oversized position cannot.
Consider partial profit-taking on the way up. Locking in a portion of gains at key levels — including the current range — removes the risk of watching a large unrealised gain evaporate in a reversal.
The $0.2357 level is the structural anchor. A sustained daily close below the reclaimed support at $0.2357 would be the clearest signal that the bullish fractal setup is failing — and the appropriate trigger to re-evaluate the position.
Bottom Line
$BANK has already validated the core of @Ryker_Crypto’s April thesis — delivering +500%+ from a $14M market cap with a structural setup that mirrors $RAVE’s pre-explosive-rally chart. The reclaimed $0.2357 level is the technical foundation of the bullish case, and the absence of unlock pressure remains a structural advantage that distinguishes $BANK from many comparable small-cap moves.
Whether the $RAVE fractal plays out in full — with a multi-thousand-percent continuation — or whether $BANK follows the correction path documented in other 2026 fractal setups will be determined by whether $0.2357 holds as support and whether new capital continues to flow into the narrative at this scale of market cap.
The fractal is compelling. The setup is real. The risk is equally real — and at +495% in seven days, disciplined position sizing and clear invalidation levels matter as much as the bullish thesis itself.
Frequently Asked Questions (FAQ)
What is Lorenzo Protocol ($BANK)?
Lorenzo Protocol is an institutional-grade on-chain asset management platform specializing in tokenized yield-generating financial products.
What is the $RAVE fractal comparison showing for $BANK?
$RAVE corrected ~70.92% before launching a +3,858% rally from $0.72 to above $28.73. $BANK has corrected a deeper ~88.16% and recently reclaimed its $0.2357 range high — mirroring $RAVE’s structural setup at the same stage.
What risk management approach is appropriate for $BANK?
Given the extreme volatility — never invest more than you can afford to lose entirely, use proper position sizing, consider partial profit-taking at key levels, and treat a sustained close below $0.2357 as a clear invalidation signal.
The opinions and market insights shared on CoinsProbe represent the views of individual authors based on prevailing market conditions at the time of publication. Cryptocurrency investments carry significant risk and volatility. Readers are encouraged to conduct their own research and seek professional financial advice before making investment decisions. CoinsProbe and its contributors do not accept responsibility for financial losses or decisions made based on published content.
CoinsProbe may publish sponsored articles, affiliate links, or promotional collaborations. All sponsored material is clearly labeled to maintain transparency with our audience. Our editorial decisions remain fully independent, and advertising partnerships do not influence reviews, rankings, or published opinions.
Since 2023, CoinsProbe has delivered reliable insights on cryptocurrency, blockchain, and digital assets. Our content is created by experienced researchers and analysts who follow strict editorial standards focused on accuracy, transparency, and credibility. Every article is carefully reviewed and verified using trusted sources and current market data. We provide unbiased analysis and timely updates covering everything from emerging crypto projects to major industry developments.