

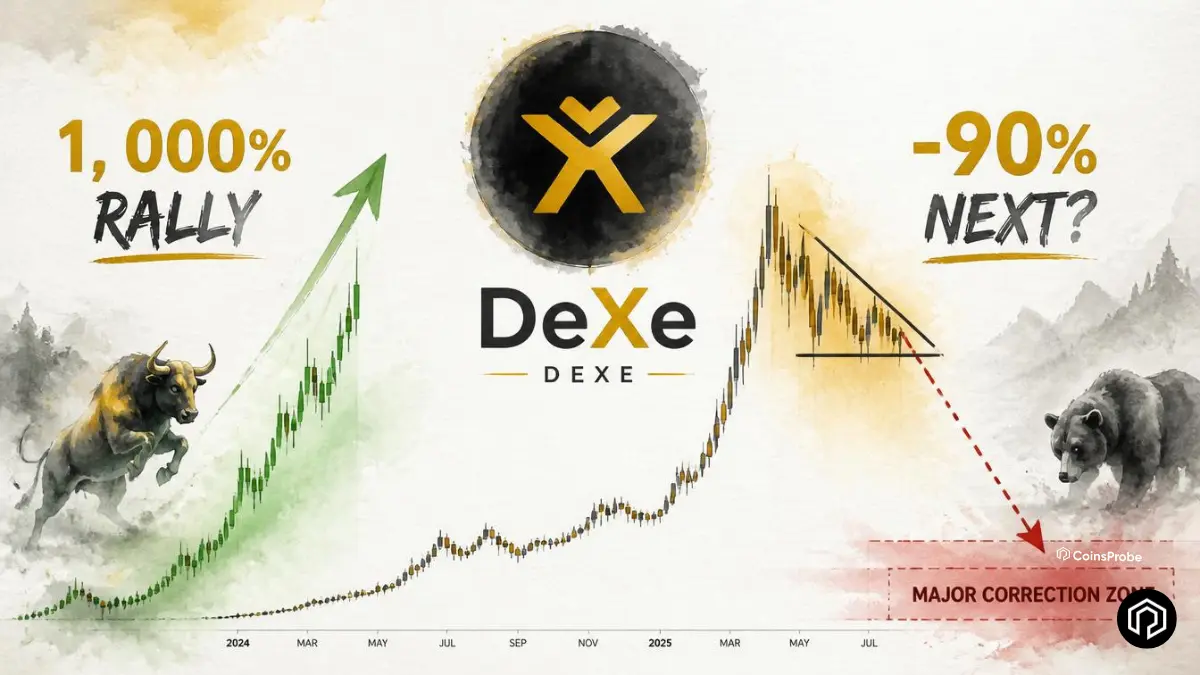

- DeXe (DEXE) is trading at $35.84, down 4.78% over 7 days, but remains up 1,005% YTD with a $3 billion market cap.
- DEXE's chart is closely mirroring Cronos (CRO)'s previous pattern, which ended in an 80–90% correction after a fakeout breakout.
- Following a local high near $49.43, DEXE has entered a correction, raising the possibility of a similar bearish fractal.
- Key support levels are $18.30 and $3.00, with the latter representing a potential 90%+ downside if the pattern repeats.
DeXe has delivered one of the most remarkable individual token performances in the entire crypto market this year — a +1,005.28% YTD gain that has taken it from obscurity to a $3 billion market cap.
But a chart pattern comparison that places DEXE’s current structure directly alongside Cronos’s 2024–2026 trajectory is raising a specific and well-documented caution flag that holders need to understand clearly.

The CRO Fractal — What Happened to Cronos
To understand what the fractal is warning about for DEXE, it is essential to first understand precisely what happened to CRO.
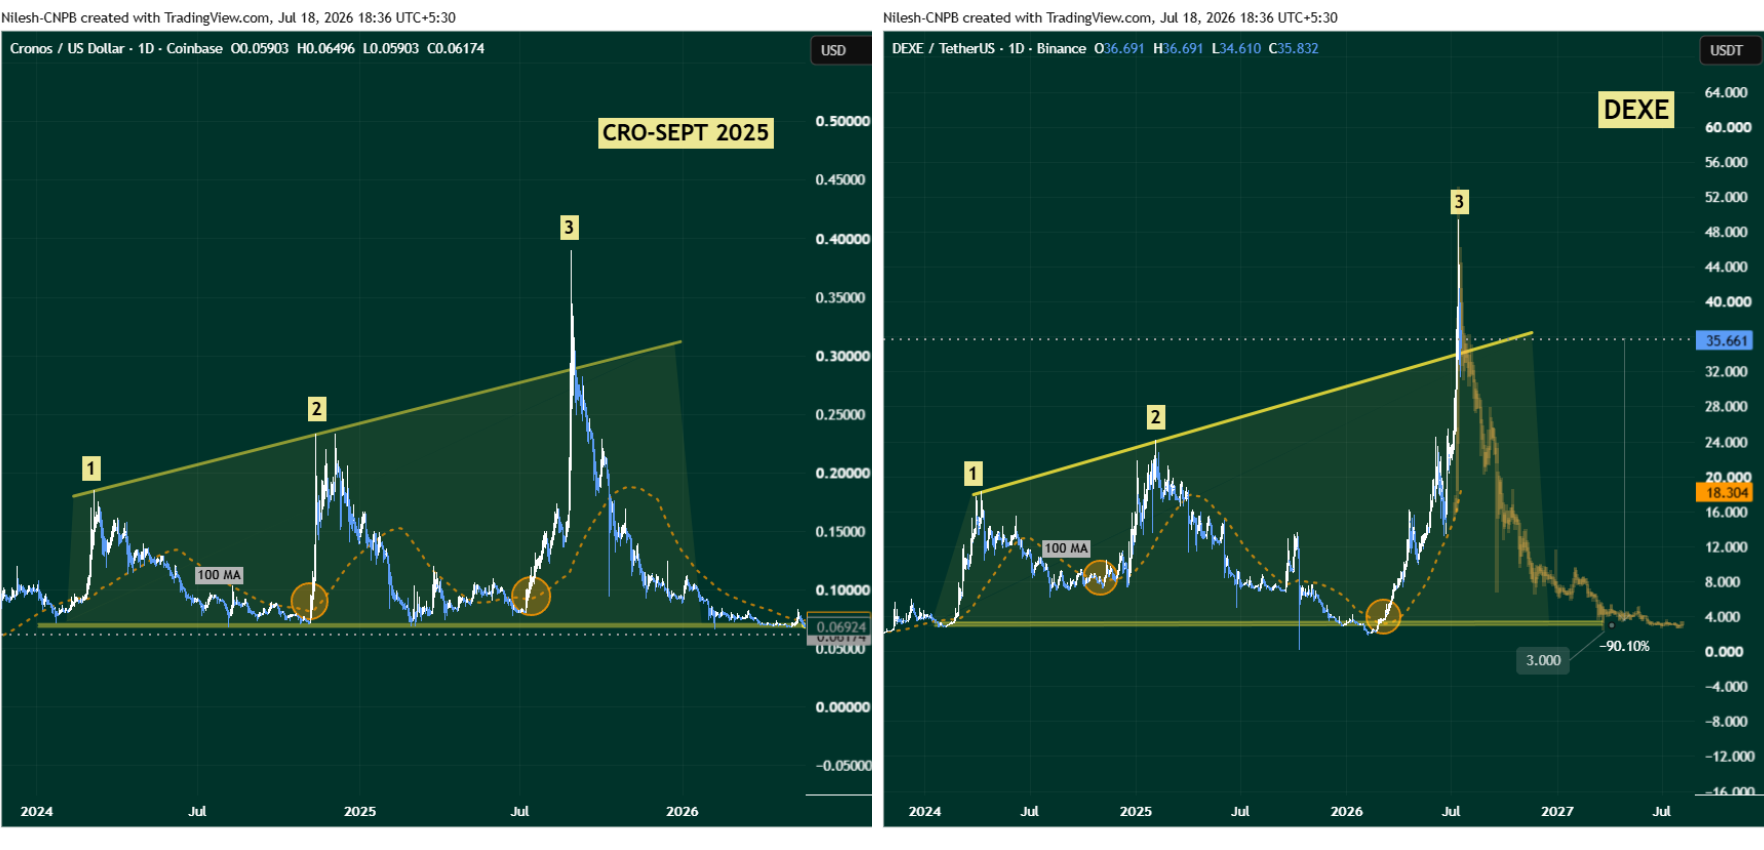
CRO’s ascending right-angled broadening wedge (2024–2026):
Cronos formed an ascending right-angled broadening wedge on its daily chart — a pattern characterised by a flat upper horizontal resistance line and a rising lower support trendline, creating an expanding range where each successive lower low is higher than the prior one while price continues to test the same horizontal ceiling.
This pattern is deceptively bullish-looking during its formation — the rising lower trendline gives the impression of sustained buying support, and multiple tests of the upper resistance create the expectation that the next attempt will produce a genuine breakout.
The fakeout:
In September 2025, CRO appeared to break above the horizontal resistance — triggering what looked like the anticipated breakout and attracting momentum buying. This move proved to be a fakeout — price briefly exceeded resistance before reversing sharply back inside the wedge, trapping buyers who entered on the apparent breakout.
The collapse:
Following the fakeout reversal, CRO broke decisively below the 100-day Moving Average — the loss of which confirmed the breakdown and accelerated selling pressure. The subsequent correction produced an -80% to -90% decline from the fakeout high, eventually finding support at long-term lows.
The pattern’s complete sequence: formation → multiple resistance tests → fakeout breakout → reversal → 100 MA breakdown → 80–90% collapse.
Where DEXE Sits in the Same Structure
The right-hand chart shows DEXE’s current daily structure — and the parallel to CRO’s prior sequence is the reason this comparison is generating significant trader attention.
DEXE’s ascending right-angled broadening wedge:
DEXE has been forming the same pattern — a flat upper horizontal resistance and a rising lower support trendline — during its extraordinary +1,005% YTD rally. The expanding range, the multiple resistance tests, and the overall structure are near-identical to CRO’s prior setup.
The fakeout:
DEXE recently completed what appears to be its own fakeout — reaching a local high near $49.43 before reversing sharply lower to the current $35–36 zone. This move matches the CRO sequence at the same structural stage: a brief exceedance of resistance that failed to hold, followed by a reversal back inside the pattern.
Current position:
DEXE is now at the stage in the fractal where CRO had just completed its fakeout and was beginning to approach the 100 MA — the level whose loss confirmed the broader breakdown. DEXE’s equivalent level is the 100-day MA at $18.30 — not yet tested, but now the primary downside reference if the bearish thesis continues to develop.
The Bearish Scenario — How Far Could DEXE Fall?
If the CRO fractal continues to develop as mapped:
Stage 1 — 100 MA test at $18.30:
A continued decline from current levels toward the 100-day Moving Average at $18.30 would represent the first major technical confirmation that the pattern is following CRO’s path. For CRO, the 100 MA breakdown was the signal that accelerated selling — loss of this level typically brings in systematic stop-losses and algorithmic sellers who use moving average crossovers as triggers.
Stage 2 — Major long-term support at $3.00:
If the 100 MA fails to hold — as it did in CRO’s case — the next significant support sits at the $3.00 zone — DEXE’s major long-term demand level. From the current price of $35.84, reaching $3.00 would represent a decline of approximately -91.6% — consistent with the -80% to -90% correction CRO experienced after its own fakeout.
| Support Level | Significance | Decline from Current |
|---|---|---|
| $18.30 | 100-day MA — breakdown trigger | ~-48.9% |
| $3.00 | Major long-term support — full fractal target | ~-91.6% |
The Bullish Invalidation — One Level Changes Everything
The fractal thesis has a specific, level-based invalidation — which is the most important number for anyone holding DEXE to understand.
A strong reclaim and sustained daily close above $49.43 — the recent local high where the fakeout occurred — would invalidate the bearish fractal entirely. A genuine close above that level would mean the apparent fakeout was not actually a fakeout, but rather a consolidation above prior resistance that the market is now confirming as valid support. In this scenario, the pattern would be interpreted as a healthy mid-rally consolidation rather than a topping formation — and the door would open for a new leg higher potentially toward fresh all-time highs.
$49.43 is therefore the single most important level for DEXE right now — everything below it keeps the bearish fractal intact, while everything above it changes the narrative fundamentally.
Why This Fractal Carries Unusual Weight
Not all fractal comparisons deserve equal attention — some are superficial visual resemblances with limited structural depth. The CRO-DEXE comparison is more substantive than most for three specific reasons:
The pattern type is the same: Both formed ascending right-angled broadening wedges — a specific, named pattern with documented behavioural characteristics — not a vague general resemblance.
The magnitude of the prior rally matches: Both CRO and DEXE achieved extraordinary percentage gains before entering the pattern’s final phase — the kind of gains that create large pools of unrealised profit available to be taken, which is the mechanical fuel for the correction phase.
The fakeout sequence matches: Both tokens produced a temporary exceedance of the horizontal resistance before reversing — the specific fakeout mechanism that traps late buyers and creates the asymmetric selling pressure that drives the collapse phase.
This type of fractal-based analysis has been one of the more reliable early-warning frameworks in the current market cycle. As we covered in our Zcash ZEC Price Prediction 2026 article — ZEC is currently mirroring XRP’s 2021–2022 collapse setup with comparable structural precision, and in our Audiera BEAT symmetrical triangle warning — BEAT showed the same pre-collapse pattern as LAB Token before its 75% crash.
The CRO-DEXE comparison adds a third documented fractal of this type in the current market — suggesting that pattern-based caution across high-momentum tokens is warranted broadly, not just in isolated cases.
Bottom Line
DeXe’s +1,005.28% YTD performance is genuinely extraordinary — and nothing about the CRO fractal changes the fundamental picture of what DEXE has delivered for holders who entered earlier in the year. What the fractal does establish is a specific, well-documented risk scenario for the current price zone: the same pattern that produced an 80–90% collapse in CRO after its fakeout appears to be developing in DEXE’s chart at the same structural stage.
The resolution is binary and level-based. A close above $49.43 invalidates the bearish thesis and opens the continuation trade. Loss of the $18.30 100 MA confirms the fractal is playing out and puts the $3.00 major support into focus as the potential full target.
Frequently Asked Questions (FAQ)
What is DeXe (DEXE)?
DeXe is a decentralised governance and social trading protocol — it has delivered +1,005.28% YTD gains making it one of 2026’s most explosive performers, with a current market cap of approximately $3 billion.
The opinions and market insights shared on CoinsProbe represent the views of individual authors based on prevailing market conditions at the time of publication. Cryptocurrency investments carry significant risk and volatility. Readers are encouraged to conduct their own research and seek professional financial advice before making investment decisions. CoinsProbe and its contributors do not accept responsibility for financial losses or decisions made based on published content.
CoinsProbe may publish sponsored articles, affiliate links, or promotional collaborations. All sponsored material is clearly labeled to maintain transparency with our audience. Our editorial decisions remain fully independent, and advertising partnerships do not influence reviews, rankings, or published opinions.
Since 2023, CoinsProbe has delivered reliable insights on cryptocurrency, blockchain, and digital assets. Our content is created by experienced researchers and analysts who follow strict editorial standards focused on accuracy, transparency, and credibility. Every article is carefully reviewed and verified using trusted sources and current market data. We provide unbiased analysis and timely updates covering everything from emerging crypto projects to major industry developments.