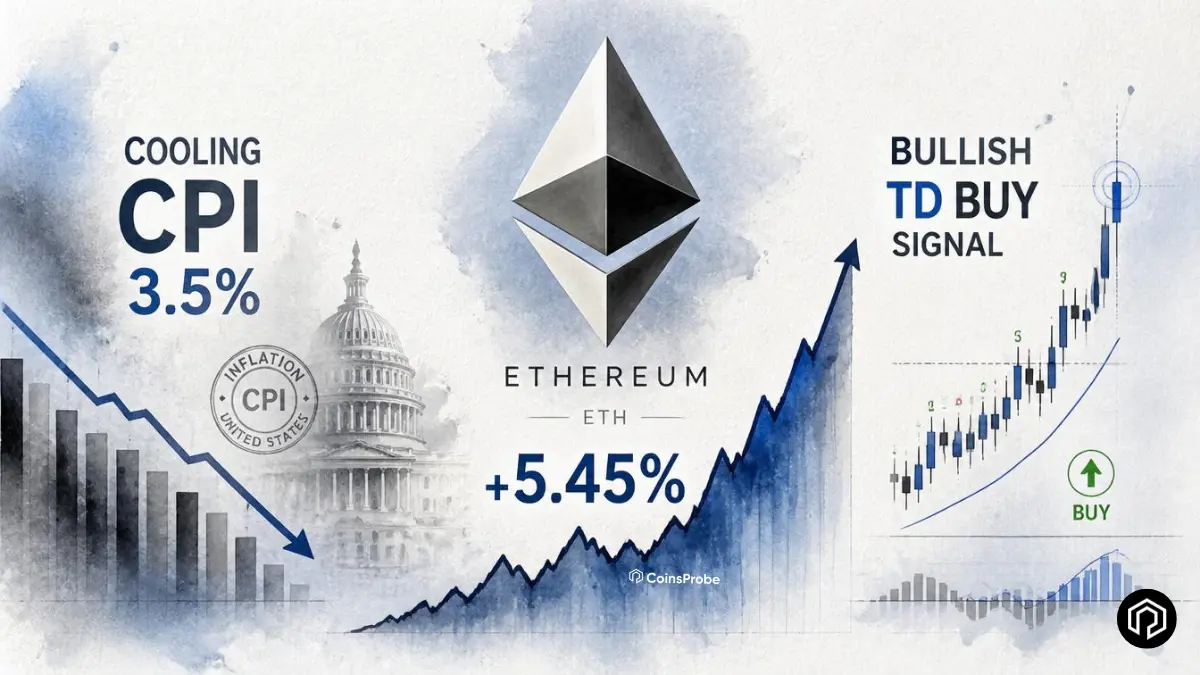

- Ethereum (ETH) is trading at $1,877.05, up 5.45% in 24 hours, as softer-than-expected US inflation sparks a broad risk-on rally.
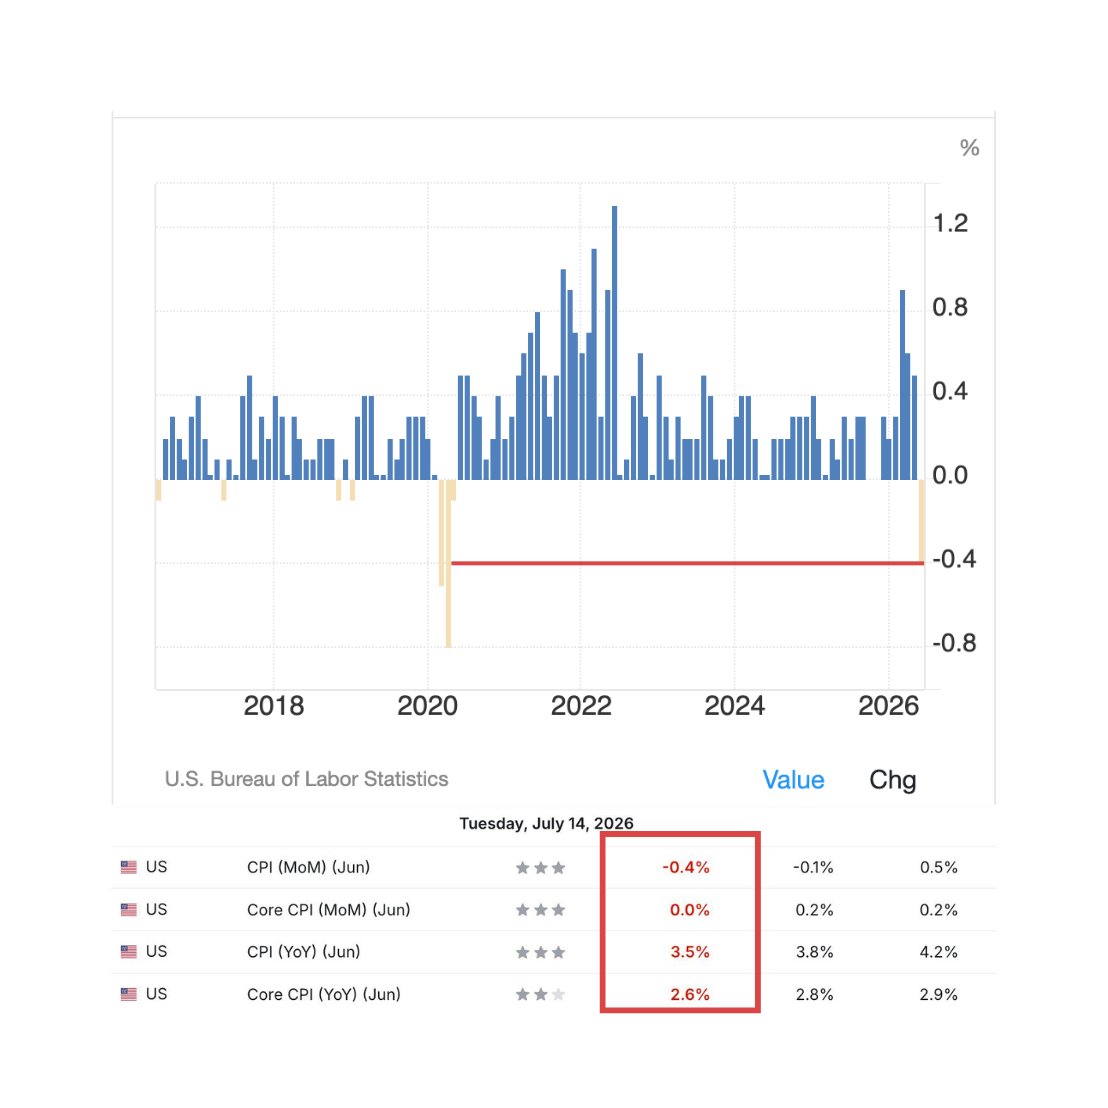
- US CPI came in at 3.5% YoY versus 3.8% expected, while Core CPI was flat at 0.0% MoM, easing concerns over further Fed tightening.
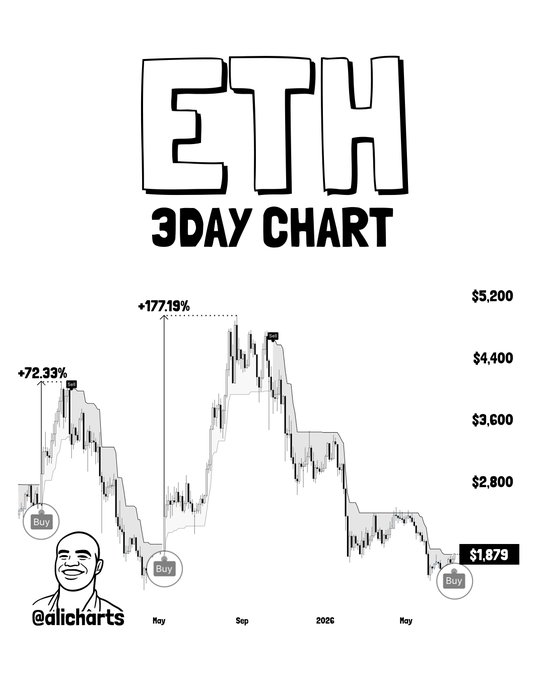
- Analyst @alicharts says Ethereum's SuperTrend indicator has turned bullish on the 3-day chart, with the previous two signals preceding 72% and 177% rallies.
- The combination of cooling inflation and a major technical buy signal is strengthening the bullish case for ETH beyond a typical relief bounce.
Ethereum (ETH) is up +5.45% in the last 24 hours, currently trading at $1,877.05 with a market capitalization of approximately $226.52 billion.
The move comes as markets react positively to fresh U.S. inflation data showing that price pressures are cooling faster than expected. This has lifted risk assets across the board, including cryptocurrencies.

Catalyst 1 — CPI Hits Its Lowest Level Since the Pandemic
The primary macro catalyst driving today’s broad risk-on move across crypto and equities is a US Consumer Price Index print that came in significantly better than market expectations:
| CPI Metric | Actual | Expected | Prior |
|---|---|---|---|
| Headline CPI (YoY) | 3.5% | 3.8% | 4.2% |
| Core CPI (MoM) | 0.0% | 0.2% | — |
The headline figure of 3.5% YoY beats the 3.8% consensus expectation by 30 basis points — but the more striking number is Core CPI at 0.0% month-over-month — a reading that effectively means there was no core inflation in June once food and energy are excluded.
Analyst @BullTheoryio captured the significance of the print directly:
“CPI JUST PRINTED ITS LOWEST NUMBER SINCE THE PANDEMIC… There was no inflation in June once food and energy are removed. Year over year, core CPI dropped to 2.6%… putting the Fed’s 2% target within real reach for the first time in a while.”
Why this specific print matters for crypto:
This is the first monthly headline CPI decline since the pandemic — a genuinely historic data point in the context of the inflation cycle that has dominated global monetary policy since 2021. With core CPI year-over-year now at 2.6%, the Federal Reserve’s 2% inflation target — which has felt distant throughout most of 2025 and 2026 — is now within meaningful striking distance for the first time.
The direct implication for risk assets: lower inflation reduces the probability of additional Fed tightening, increases the probability of eventual rate cuts, and removes one of the most persistent headwinds that has been suppressing risk appetite across both equities and crypto throughout 2026. As we covered in our Bitcoin drops as Trump declares Iran MOU over and FOMC minutes loom article — monetary policy signals have been among the most consistent short-term Bitcoin and Ethereum price drivers of the year. Today’s CPI print is the most unambiguously positive monetary policy signal of 2026 so far.
Catalyst 2 — SuperTrend Flips Bullish on the 3-Day Chart
Beyond the macro catalyst — analyst @alicharts identified a technical development on Ethereum’s chart that adds a second independent reason for attention:
“The SuperTrend indicator has just turned bullish on Ethereum. The last two buy signals on the 3-day chart were followed by bull rallies of 72% and 177%.”
What the SuperTrend indicator measures:
The SuperTrend is a trend-following indicator that flips between bullish and bearish signals based on price action relative to volatility-adjusted support and resistance levels. When it flips from bearish to bullish — as it has just done on ETH’s 3-day chart — it signals that the prevailing downtrend has given way to the beginning of a potential uptrend.
Why the 3-day timeframe matters:
The 3-day chart sits between the daily and weekly — providing a longer-term signal than daily indicators while being more responsive than weekly ones. A SuperTrend flip on this specific timeframe represents a more significant structural shift than a daily signal, but a more timely one than a weekly signal.
The historical track record on ETH:
The last two SuperTrend buy signals on ETH’s 3-day chart were followed by:
| Signal | Subsequent Rally |
|---|---|
| Prior signal 1 | +72% |
| Prior signal 2 | +177% |
Two data points is not a statistically exhaustive sample — but the magnitude of both prior outcomes makes this signal worth monitoring closely, particularly when it coincides with the kind of macro catalyst today’s CPI print represents.
This connects directly to the broader accumulation of Ethereum technical signals we have been documenting throughout June and July 2026 — including the monthly TD Sequential buy signal that appeared at the start of July and the historic monthly RSI low that confirmed extreme oversold conditions. The SuperTrend flip adds a third independent technical signal to that growing body of evidence.
Why Both Catalysts Together Matter More Than Either Alone
A macro catalyst without technical confirmation can produce a short-lived sentiment bounce that fades as conditions normalise. A technical signal without macro support can struggle to develop into a sustained move if the broader environment remains risk-off.
Today’s setup has both:
The CPI print removes the most persistent macro headwind — Fed tightening risk — and creates a genuine reason for risk-on capital to return to assets like Ethereum that have been under sustained pressure.
The SuperTrend flip provides the technical confirmation that this specific moment — rather than a prior or future moment — is when the structure is turning. It gives traders a defined, historically-validated entry signal rather than requiring them to guess timing.
Together, they describe a setup where the macro conditions support a move and the technical structure is confirming that move is beginning — which is historically when the strongest risk-asset recoveries tend to start.
The Broader Ethereum Context
As we covered in our Lean Ethereum roadmap article — Vitalik Buterin’s July 4 announcement of Ethereum’s 2026–2030 protocol redesign adds a fundamental development layer to the technical and macro picture. Recursive STARKs, post-quantum cryptography, 10x lower transaction costs, and native privacy are the kind of long-term improvements that attract sustained institutional attention when the macro environment begins to cooperate.
And as we covered in our $1,580 support and three-year demand zone article — ETH has just bounced from the $1,580 level that triggered +149% and +203% rallies in prior instances. Today’s move to $1,877 represents meaningful progress above that critical floor — adding to the case that the bounce is developing momentum.
Bottom Line
Ethereum’s +5.45% move to $1,877 today is supported by two independently significant catalysts: the most encouraging US CPI print since the pandemic removing the Fed tightening headwind, and a SuperTrend bullish flip on the 3-day chart whose last two occurrences preceded rallies of +72% and +177%.
Neither catalyst alone makes a sustained recovery certain — but the combination of improving macro conditions and a historically validated technical buy signal arriving on the same day is the kind of multi-factor setup that has historically marked the beginning of more durable recoveries rather than temporary bounces.
Frequently Asked Questions (FAQ)
Why is Ethereum up 5% today?
Two simultaneous catalysts — US CPI came in at 3.5% YoY (vs 3.8% expected) with Core CPI at 0.0% MoM, the lowest reading since the pandemic — combined with a SuperTrend bullish flip on Ethereum’s 3-day chart.
What did the CPI data show?
Headline CPI at 3.5% YoY — beating the 3.8% expectation and down from 4.2% prior. Core CPI at 0.0% MoM — the first monthly headline CPI decline since the pandemic, with year-over-year core CPI dropping to 2.6%.
What is the SuperTrend indicator?
A trend-following indicator that flips between bullish and bearish signals based on price relative to volatility-adjusted levels. A bullish flip on the 3-day chart signals the prevailing downtrend may be giving way to an uptrend.
What did the prior SuperTrend buy signals produce for ETH?
The last two 3-day SuperTrend buy signals on Ethereum were followed by rallies of +72% and +177% respectively.
Why does lower CPI help Ethereum and crypto?
Lower inflation reduces the probability of Fed tightening, increases rate cut expectations, and removes one of the most persistent risk-off headwinds — boosting sentiment across risk assets including crypto.
The opinions and market insights shared on CoinsProbe represent the views of individual authors based on prevailing market conditions at the time of publication. Cryptocurrency investments carry significant risk and volatility. Readers are encouraged to conduct their own research and seek professional financial advice before making investment decisions. CoinsProbe and its contributors do not accept responsibility for financial losses or decisions made based on published content.
CoinsProbe may publish sponsored articles, affiliate links, or promotional collaborations. All sponsored material is clearly labeled to maintain transparency with our audience. Our editorial decisions remain fully independent, and advertising partnerships do not influence reviews, rankings, or published opinions.
Since 2023, CoinsProbe has delivered reliable insights on cryptocurrency, blockchain, and digital assets. Our content is created by experienced researchers and analysts who follow strict editorial standards focused on accuracy, transparency, and credibility. Every article is carefully reviewed and verified using trusted sources and current market data. We provide unbiased analysis and timely updates covering everything from emerging crypto projects to major industry developments.