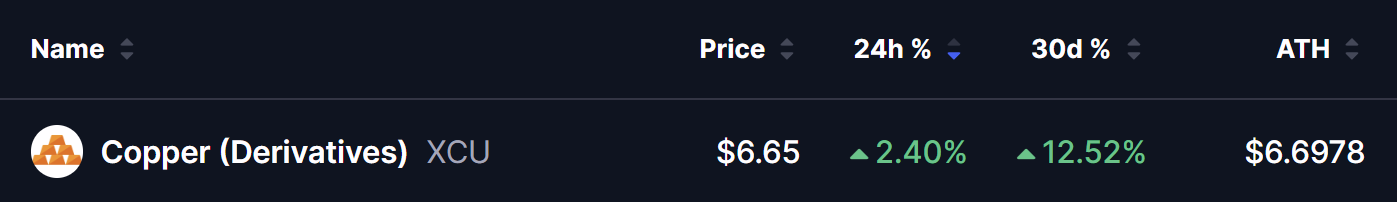
- Copper has surged to a new all-time high near $6.70/lb — currently trading at $6.65 — up +2.40% in 24 hours and +12.52% over 30 days.
- A side-by-side fractal chart by analyst @cantonmeow shows copper and silver following a near-identical multi-year technical pattern — with copper now breaking out at the same structural point where silver launched its parabolic surge.
- Silver already completed its move — rallying from approximately $40 to a peak of $121 from a similar consolidation setup. Copper is now following the same script.
- Structural demand drivers — AI data centres, electrification, EV adoption, and chronic supply deficits — are providing the fundamental foundation beneath the technical breakout.
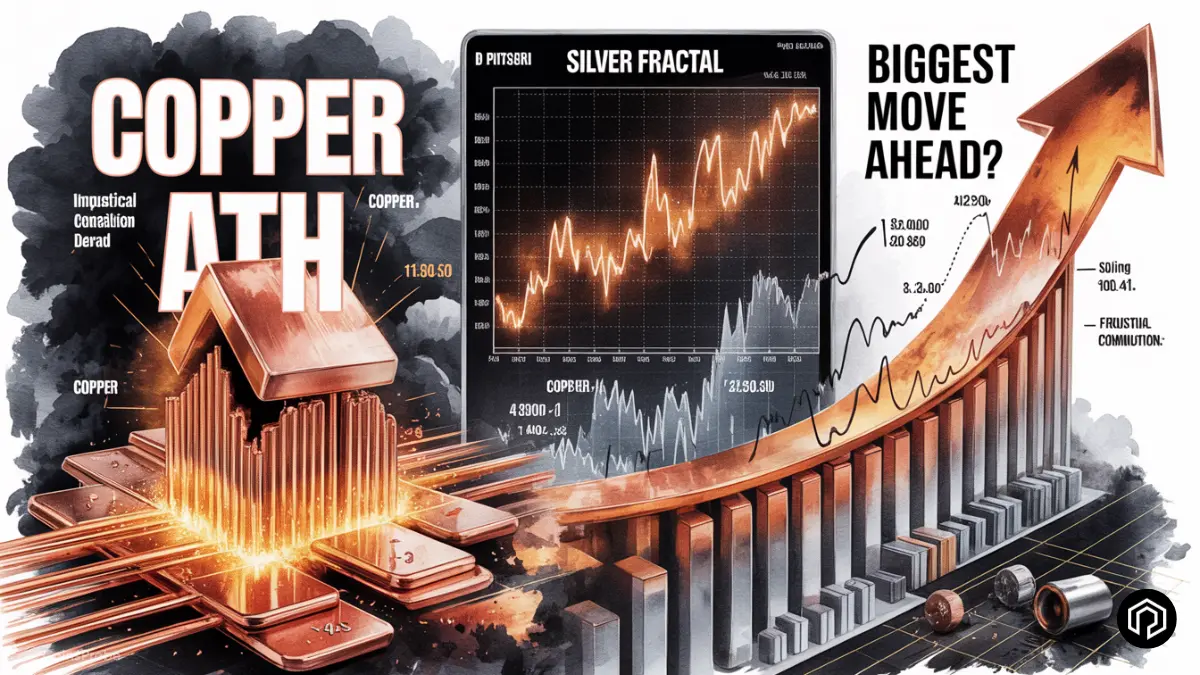
Copper is in record territory. The red metal has officially broken to a new all-time high near $6.70/lb — with spot prices currently trading at $6.65 as of May 13, 2026 — and the technical picture suggests this move may have significantly further to run.
The breakout is not happening in isolation. A chart shared by trader @cantonmeow on May 12 is drawing widespread attention for a compelling reason: it shows copper and silver following a near-identical fractal pattern over the past seven years — and silver has already completed the move that copper appears to be just beginning.
The Fractal Chart — Copper Following Silver’s Playbook
The side-by-side monthly chart comparison covers both metals from 2019 through 2026 — and the structural similarity between the two is striking:
The shared pattern:
Sharp crash in 2020 — Both copper and silver experienced severe declines in early 2020 — copper dropping to multi-year lows near $2.10/lb and silver collapsing to approximately $11.75/oz — before mounting sharp recoveries.
Multi-year base-building and consolidation (2022–2024) — After the initial post-crash recovery, both metals entered extended sideways consolidation phases lasting two to three years — compressing within a tight range while supply and demand dynamics rebalanced. The blue circle highlighted on both charts marks this consolidation zone — the structural setup that preceded the explosive move.
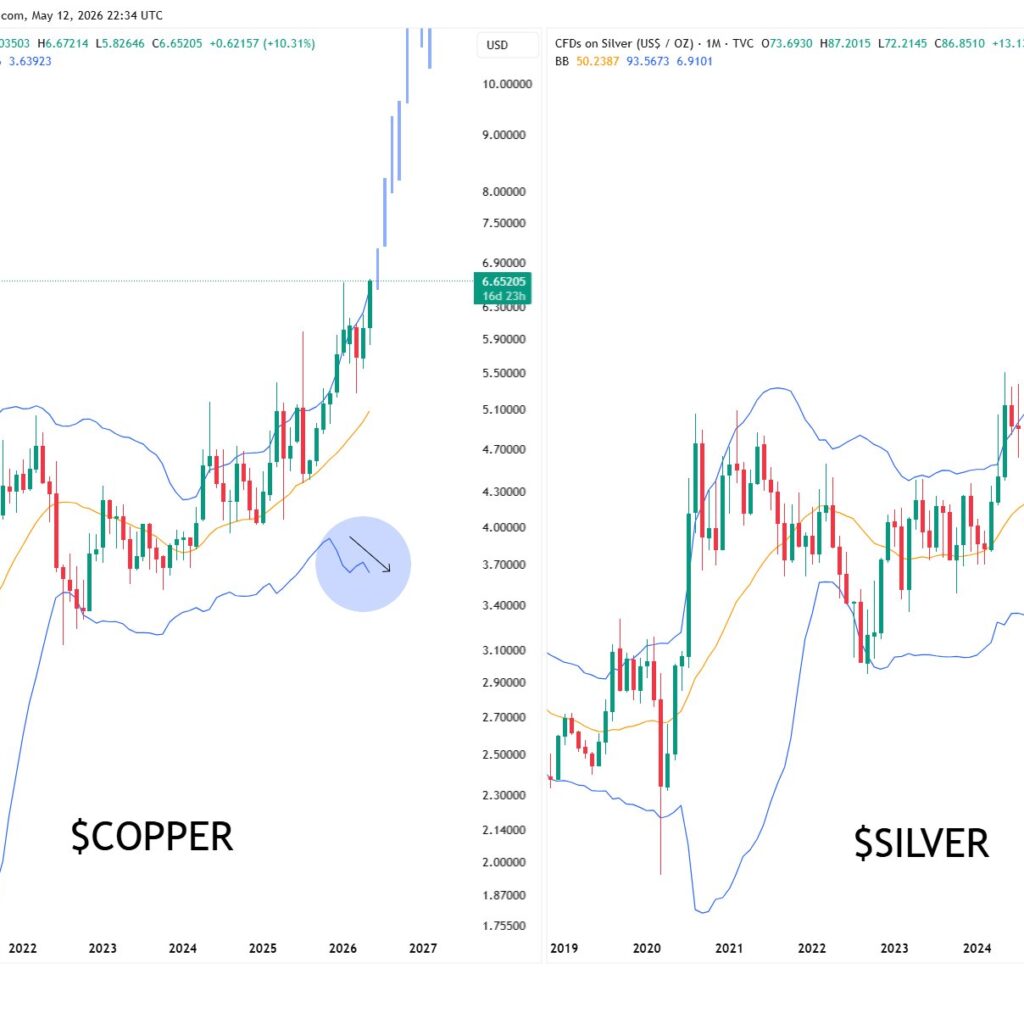
Powerful breakout in late 2025 — Both metals launched significant breakouts from their consolidation bases in late 2025 — with momentum accelerating through 2026.
The critical difference — timing:
Silver completed its move first — surging from approximately $40 to a peak of $121/oz from the consolidation zone highlighted on the chart. That is a +202% move from the breakout level — one of the most powerful sustained rallies in silver’s modern trading history.
Copper is now at the same structural position silver was at before that move — breaking out of its multi-year consolidation to fresh all-time highs with expanding momentum. If the fractal continues to play out, the implication is that copper’s breakout has significantly more room to extend.
What Is Driving Copper’s Rally — The Fundamental Case
The fractal analysis does not exist in a vacuum. Copper’s technical breakout is supported by a fundamental demand story that is as compelling as any in global commodities:
AI Data Centre Infrastructure
The AI infrastructure buildout is one of the most copper-intensive construction cycles in modern history. Hyperscale data centres — the facilities that power large language models and AI training runs — require tens of thousands of tons of copper per facility for power cabling, transformers, cooling systems, and electrical distribution. As AI investment continues to accelerate through 2026 and beyond, each new data centre represents a significant incremental copper demand event.
Electrification and Green Energy Transition
The global transition toward electrification is structurally multi-decade in scope. Electric vehicles use approximately four times more copper than internal combustion engine vehicles. Solar and wind energy projects require copper-intensive inverters, cabling, and grid connection equipment. National grid modernisation programmes across the U.S., Europe, and Asia are adding another major demand layer. Global copper demand is projected to rise approximately 50% by 2040 — a structural shift that cannot be met by existing mine supply.
Chronic Supply Constraints
On the supply side, the outlook is structurally constrained. Production disruptions in Chile and the Democratic Republic of Congo — the world’s two largest copper producers — have kept the market in persistent deficit. New copper mines require 15–20 years from discovery to production — meaning meaningful new supply cannot respond to the current price signal for well over a decade. The supply-demand imbalance is structural, not cyclical.
Bottom Line
Copper’s all-time high at $6.65/lb is not the end of a move — it is the beginning of one, if the silver fractal parallel holds. The technical setup is compelling: an identical multi-year base-building structure, a near-simultaneous breakout from the same type of consolidation zone, and a demand-side fundamental story — AI infrastructure, electrification, green energy, and structural supply deficits — that has no equivalent on the supply side for over a decade.
Silver showed what this pattern looks like when it completes. Copper is following the same script — with structural tailwinds that may make the move even more durable than silver’s.
The path of least resistance remains higher. And with meaningful new supply years away and demand acceleration accelerating on multiple fronts simultaneously, the question is not whether copper continues higher — it is how far.
Frequently Asked Questions (FAQ)
Why is copper hitting record highs in 2026?
Copper surged to new highs near $6.70/lb due to rising demand from AI data centres, EVs, renewable energy, and power grid upgrades, while global mine supply remains tight.
What is the copper–silver fractal pattern?
Analyst @cantonmeow noted copper is following a chart structure similar to silver’s earlier breakout — featuring a 2020 crash, long consolidation, and major 2025 breakout.
How much did silver rally from this setup?
Silver climbed from around $40 to nearly $121 per ounce — a gain of more than 200% after breaking out from the same structure.
How is AI increasing copper demand?
AI data centres require massive amounts of copper for wiring, cooling systems, transformers, and power infrastructure.
The opinions and market insights shared on CoinsProbe represent the views of individual authors based on prevailing market conditions at the time of publication. Cryptocurrency investments carry significant risk and volatility. Readers are encouraged to conduct their own research and seek professional financial advice before making investment decisions. CoinsProbe and its contributors do not accept responsibility for financial losses or decisions made based on published content.
CoinsProbe may publish sponsored articles, affiliate links, or promotional collaborations. All sponsored material is clearly labeled to maintain transparency with our audience. Our editorial decisions remain fully independent, and advertising partnerships do not influence reviews, rankings, or published opinions.
Since 2023, CoinsProbe has delivered reliable insights on cryptocurrency, blockchain, and digital assets. Our content is created by experienced researchers and analysts who follow strict editorial standards focused on accuracy, transparency, and credibility. Every article is carefully reviewed and verified using trusted sources and current market data. We provide unbiased analysis and timely updates covering everything from emerging crypto projects to major industry developments.