
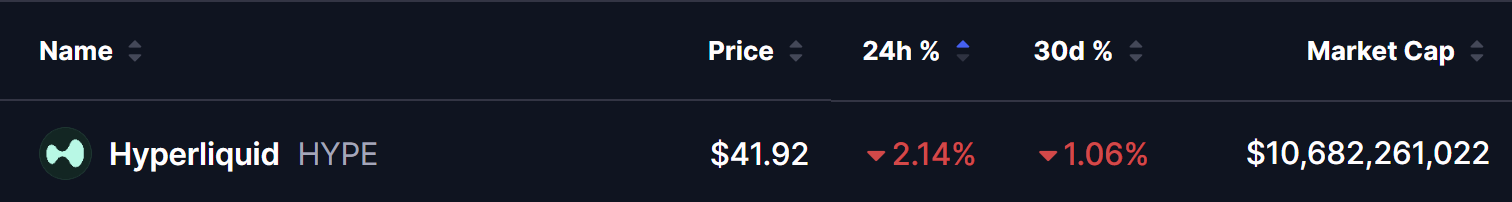
- HYPE is trading at $41.92 — down -2.14% in 24 hours and -1.06% over 30 days — with a market cap of approximately $10.68 billion.
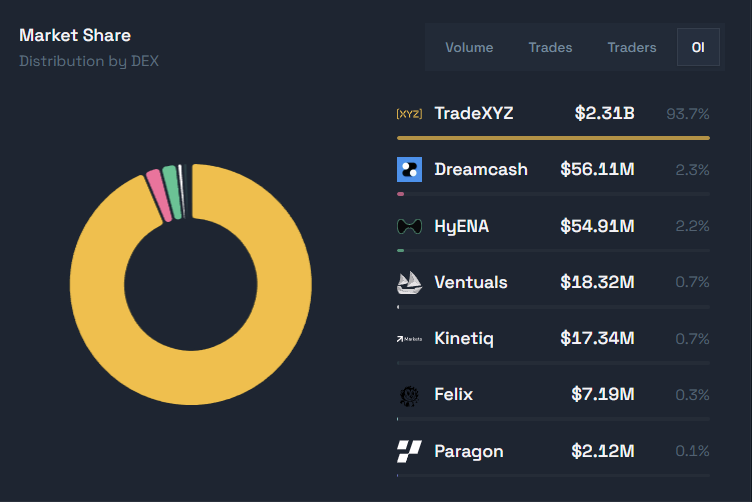
- HIP-3 open interest has surged to a new all-time high of $2.46 billion — with trade.xyz dominating at $2.31 billion (93.7% market share).
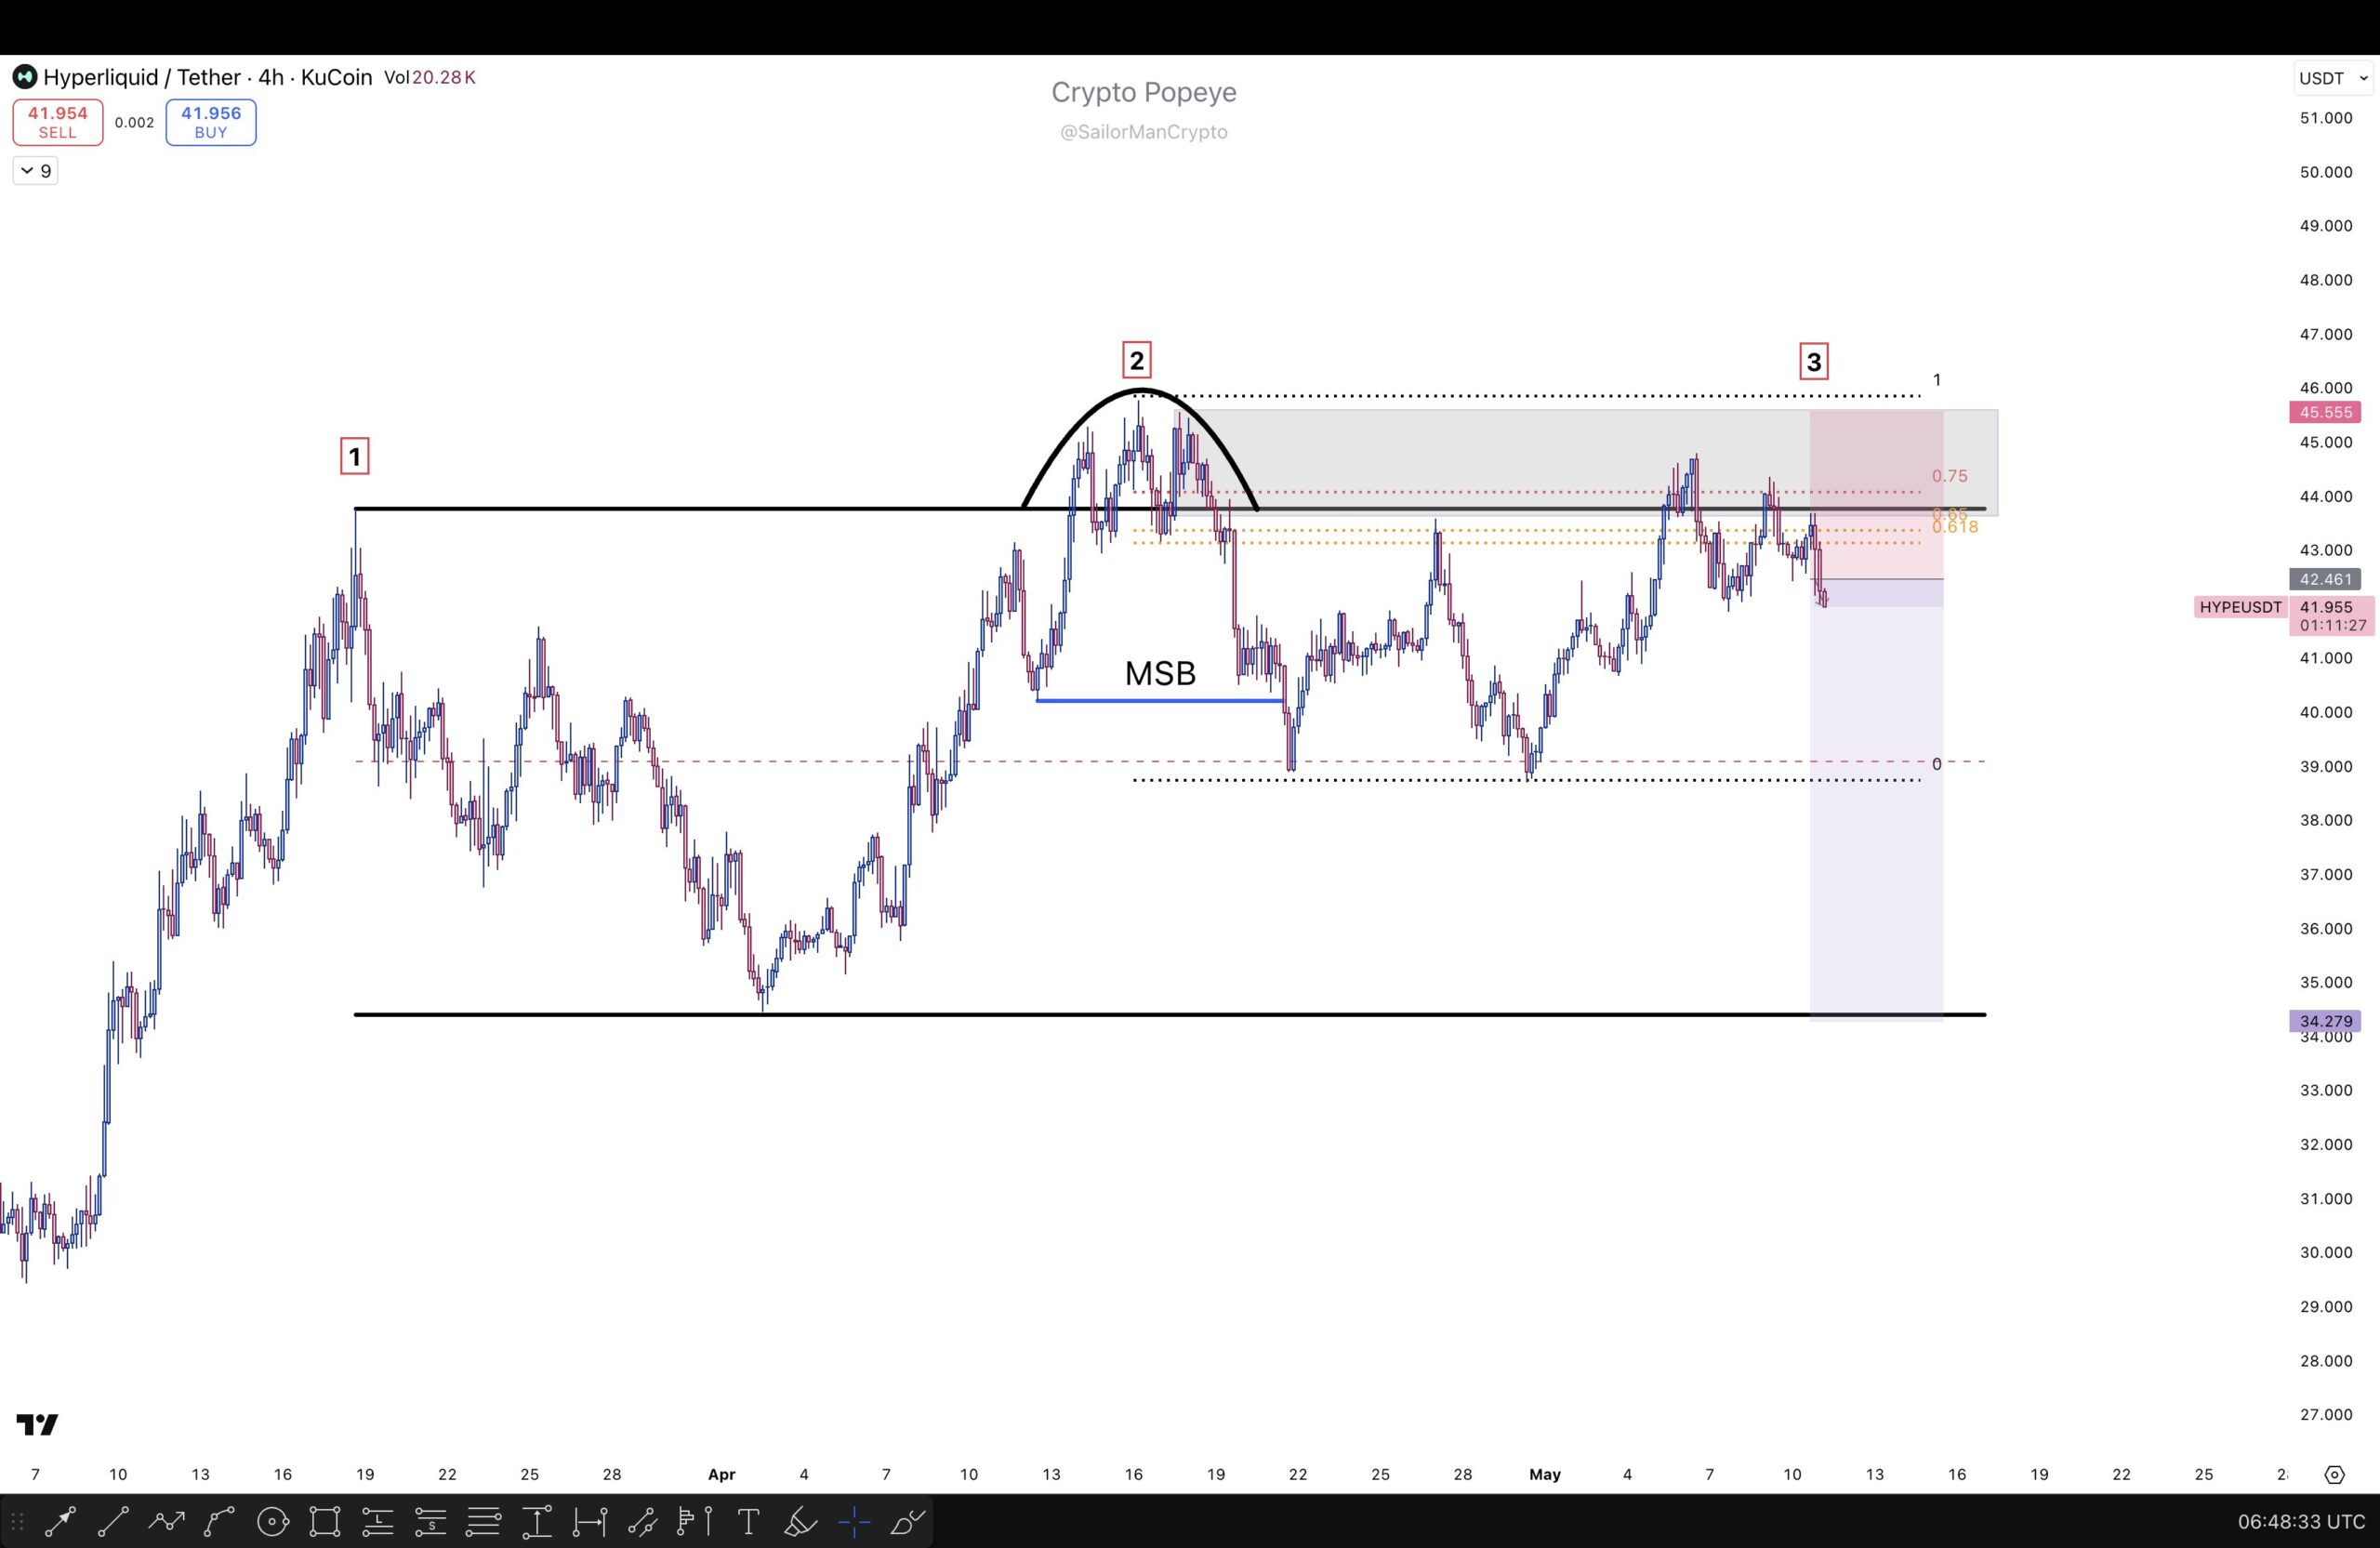
- Analyst has identified a bearish range deviation setup on the 4H chart — with a classic "3-tap" deviation above range highs and a confirmed Market Structure Break (MSB) to the downside.
- The setup targets $34.279 on the downside — with the thesis invalidated on a sustained close above $44.78.
Hyperliquid is delivering a study in contrasts this week. On the fundamental side — record-breaking open interest, dominant market share in the HIP-3 ecosystem, and continued platform expansion across perpetuals, prediction markets, and real-world asset listings. On the technical side — a developing bearish range deviation setup on the 4-hour chart that has a prominent analyst flagging a potential move toward $34 from the current $41.92.
Both stories are worth understanding — because they are not necessarily contradicting each other. Strong fundamental growth and short-term technical corrections often coexist in high-momentum assets, and HYPE’s current setup is a textbook example of exactly that dynamic.
HYPE Price at a Glance — May 11, 2026
As we covered in our HIP-4 binary prediction markets launch and trade.xyz Pre-IPO Perpetuals article, HYPE has been one of the standout performers in DeFi in 2026 — with its market cap exceeding $10 billion and each successive HIP expansion adding new revenue streams and user categories to the ecosystem. The short-term price softness does not reflect any fundamental deterioration — it reflects a technical pattern that the chart is now working through.
Fundamental Signal — HIP-3 Open Interest Hits $2.47 Billion ATH
The most significant fundamental development for Hyperliquid this week has nothing to do with the price of HYPE — it is what is happening inside the platform.
Open interest across DEXes in the HIP-3 ecosystem has surged to a new all-time high of $2.47 billion — with the latest snapshot showing approximately $2.47 billion total. The daily open interest chart reveals a strong and sustained upward trend throughout early 2026, culminating in a significant spike in May that pushed the metric to levels never seen before in Hyperliquid’s history.
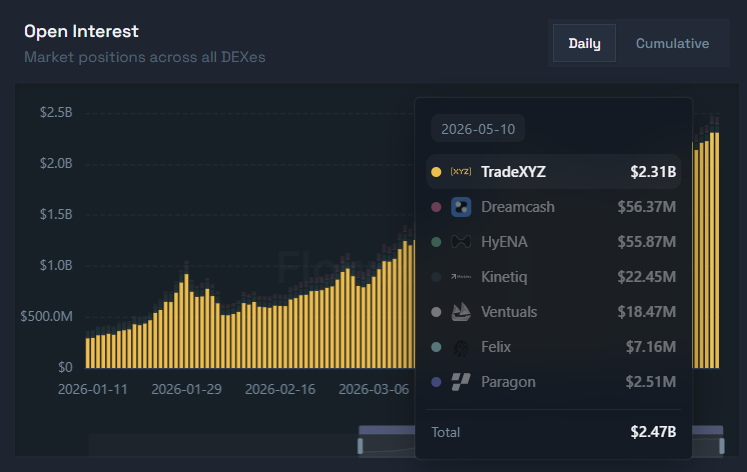
The distribution of that open interest tells the story of how dominant trade.xyz has become within the HIP-3 ecosystem:
trade.xyz’s 93.7% market share of a $2.47 billion open interest base is a number that deserves to be read carefully. It means that essentially the entire real-world asset perpetuals ecosystem on Hyperliquid — stocks, indices, commodities, Pre-IPO contracts, and now the Nifty 50 — is running through a single dominant builder. As we detailed in our Hyperliquid NIFTY 50 listing article, trade.xyz’s aggressive ticker auction strategy and expanding product roster are directly driving this open interest dominance.
What this record open interest signals:
The $2.46 billion ATH in HIP-3 open interest is not just a vanity metric — it represents real capital committed to open positions on Hyperliquid’s infrastructure. Every dollar of open interest represents a trader with an active position — paying funding rates, generating fee revenue, and contributing to the platform’s economic flywheel. A record high in open interest during a period of broader market consolidation is a strong signal of genuine conviction from both institutional and retail participants — not just speculative froth that evaporates when volatility spikes.
For HYPE holders, this matters because every dollar of open interest on the platform generates economic activity that accrues to the HYPE token through staking rewards, fee distributions, and the buyback mechanisms tied to platform revenue.
Technical Analysis — Bearish Range Deviation Setup
While the fundamentals are making new records, the 4-hour HYPE chart is telling a more cautious short-term story — and prominent analyst @SailorManCrypto (known as Crypto Popeye) has laid out the setup in detail.
The Range Structure
The 4-hour chart shows HYPE trading within a well-defined horizontal range — bounded by a clear upper supply zone near $44–$45.50 and a lower support boundary near $34.279. This range has been in place since mid-March 2026 and has produced three distinct reaction points at the upper boundary — the “3-tap” structure that forms the core of the bearish setup.
The Three Key Points:
Point 1 — The initial range high established at the upper boundary — the first test of the supply zone that defined the top of the range.
Point 2 — The bearish deviation. Price pushed above the range high — a classic liquidity sweep designed to trigger stop losses above resistance and attract breakout buyers — before being swiftly rejected back inside the range. This deviation above the dotted upper boundary is the pivotal moment in the setup — it represents smart money engineering a false breakout to accumulate short positions at premium prices.
Point 3 — The current retest. Following the MSB (Market Structure Break) to the downside that confirmed the bearish shift in momentum, price has retested the confluence zone of the range high, prior supply, and Fibonacci retracement levels — sitting near $42–$44. This retest is the entry opportunity the setup has been building toward.
Fibonacci Confluence
The current price zone near $42–$44 sits at the 0.75 and 0.818 Fibonacci retracement levels visible on the chart — precisely the zone where price would be expected to stall during a retest of the prior breakdown level before continuing lower. This Fibonacci confluence with the supply zone and the range high retest creates a high-probability resistance cluster that strengthens the bearish case if price fails to reclaim above $44.78.
What’s Next for HYPE — Two Scenarios
Bearish Scenario — The Setup Plays Out
If HYPE continues to respect the supply zone at $42–$44.78 and fails to reclaim above the range high with conviction, the setup targets the $34.279 lower range boundary as the measured downside objective. From the current $41.92, this represents a potential -18.2% move — a meaningful correction but one that would still leave HYPE well above the lows of early 2026 and within the broader bullish structural context that the platform’s record open interest supports.
The path lower would likely follow the dotted support levels visible on the chart — with $39 as an intermediate support zone before the deeper $34.279 target.
Bullish Invalidation — Setup Fails
A sustained 4H close above $44.78 — the level analyst identifies as the invalidation point — would signal that the bearish range deviation thesis has failed. In this scenario buyers have absorbed the supply zone with enough conviction to break above the prior range high cleanly — likely triggering a short squeeze toward $45.50+ and potentially extending toward the $51 level visible at the top of the chart.
Given HYPE’s strong fundamental backdrop — $2.47 billion in HIP-3 open interest, continued platform expansion, and the broader crypto market recovery — this bullish invalidation scenario cannot be dismissed. Strong fundamentals have a tendency to resolve technical bearish setups upward rather than downward.
Bottom Line
Hyperliquid presents two stories simultaneously in May 2026. Fundamentally — a platform firing on all cylinders, with HIP-3 open interest at an all-time high of $2.46 billion and trade.xyz controlling 93.7% of a rapidly growing real-world asset perpetuals ecosystem. Technically — a bearish range deviation setup on the 4H chart with a confirmed MSB and a $34.279 downside target if the supply zone at $42–$44.78 continues to hold as resistance.
Both stories are real. The resolution will depend on which force — fundamental conviction or technical selling pressure — proves stronger in the coming days. Watch $44.78 as the line that decides which story wins.
Frequently Asked Questions (FAQ)
Why is Hyperliquid ($HYPE) declining today?
HYPE is trading near $41.92, down 2.14% in 24 hours, mainly due to a short-term bearish technical setup on the 4H chart.
What is the latest HIP-3 open interest milestone?
HIP-3 open interest has reached a new all-time high of $2.47 billion, showing strong activity across Hyperliquid’s ecosystem.
What is the bearish setup on HYPE’s chart?
Analysts identified a bearish range deviation where price was rejected after sweeping liquidity above resistance, followed by a downside market structure break.
What is the downside target for HYPE?
The current bearish setup points toward the $34.27 support zone if selling pressure continues.
What level invalidates the bearish setup?
A sustained 4H close above $44.78 would invalidate the bearish outlook.
The opinions and market insights shared on CoinsProbe represent the views of individual authors based on prevailing market conditions at the time of publication. Cryptocurrency investments carry significant risk and volatility. Readers are encouraged to conduct their own research and seek professional financial advice before making investment decisions. CoinsProbe and its contributors do not accept responsibility for financial losses or decisions made based on published content.
CoinsProbe may publish sponsored articles, affiliate links, or promotional collaborations. All sponsored material is clearly labeled to maintain transparency with our audience. Our editorial decisions remain fully independent, and advertising partnerships do not influence reviews, rankings, or published opinions.
Since 2023, CoinsProbe has delivered reliable insights on cryptocurrency, blockchain, and digital assets. Our content is created by experienced researchers and analysts who follow strict editorial standards focused on accuracy, transparency, and credibility. Every article is carefully reviewed and verified using trusted sources and current market data. We provide unbiased analysis and timely updates covering everything from emerging crypto projects to major industry developments.