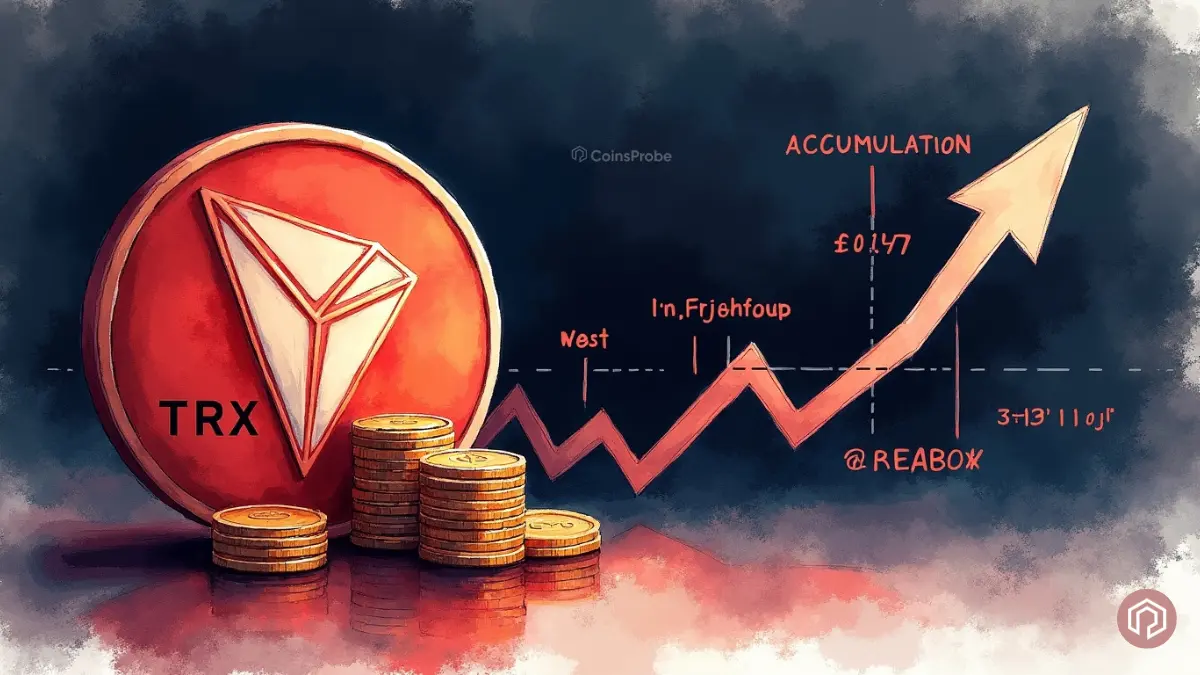

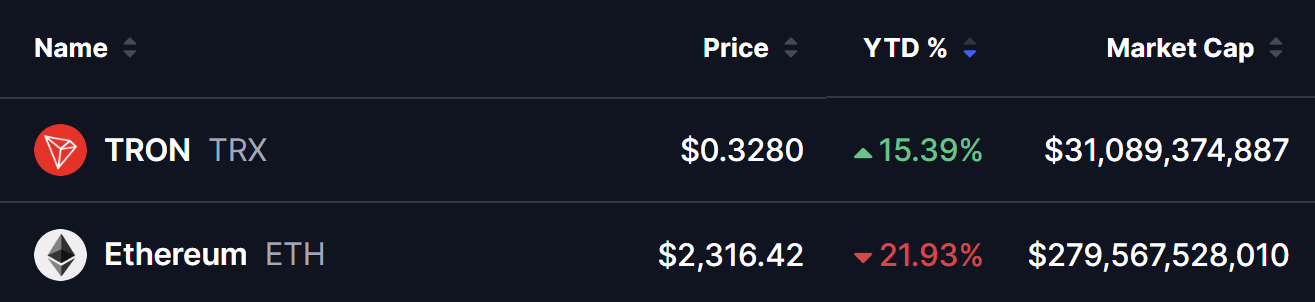
- TRON (TRX) trades around $0.328, outperforming Ethereum amid recent market divergence.
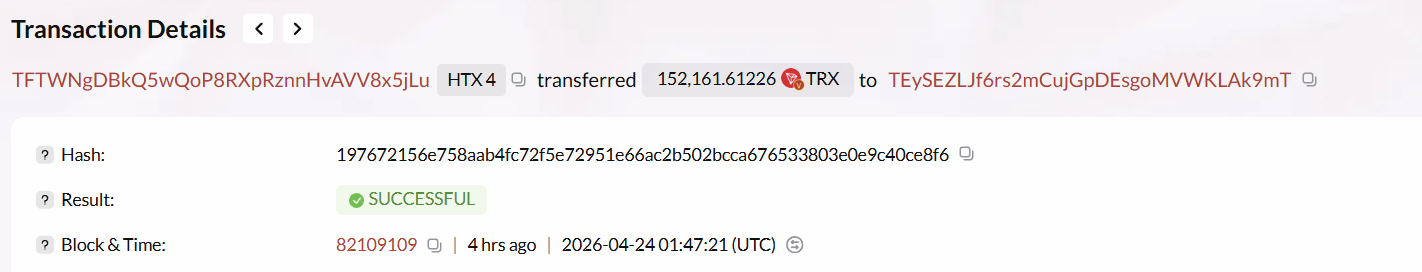
- Tron Inc. acquired 152,162 TRX, pushing total treasury holdings above 693 million TRX.
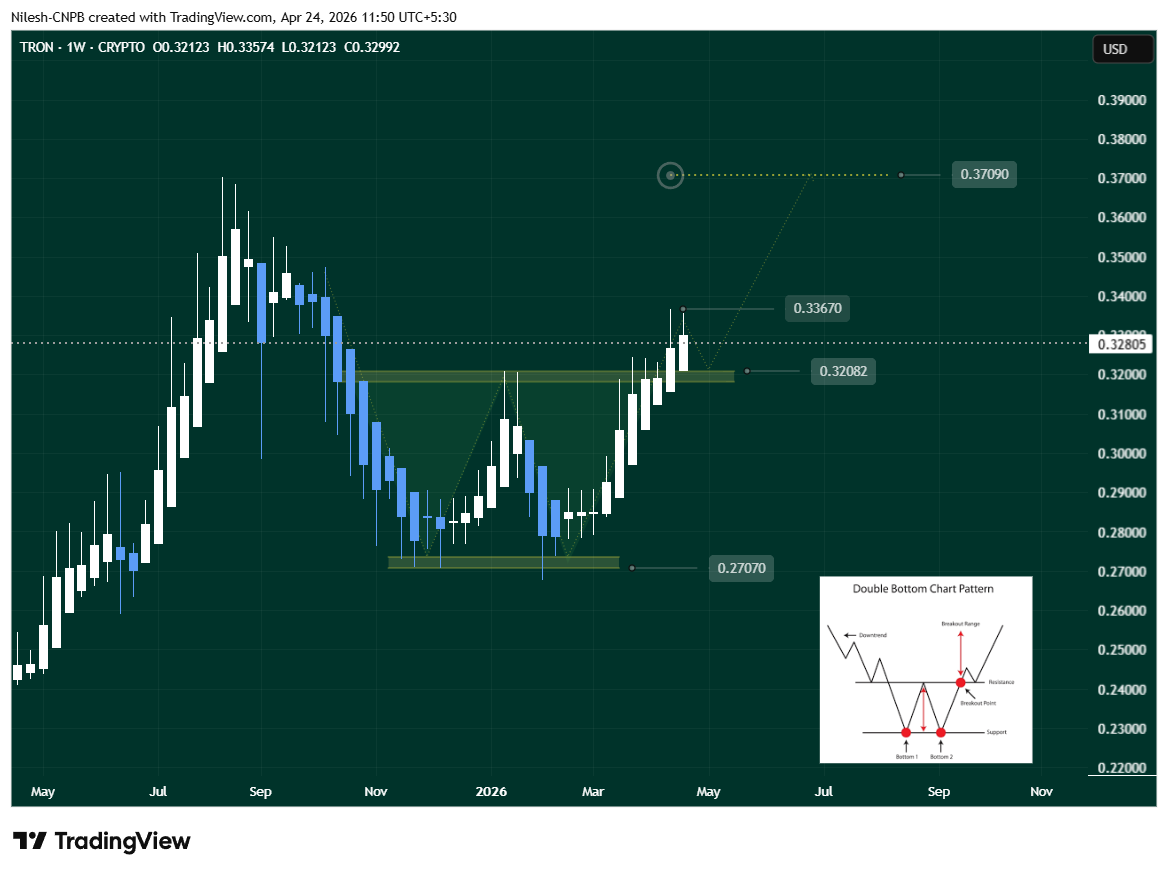
- TRX confirms a bullish double bottom breakout above the $0.32082 neckline.
- Price targets $0.3709 if momentum sustains, marking ~13% upside potential.
- Breakdown below $0.3180–$0.32082 support could invalidate the bullish setup.
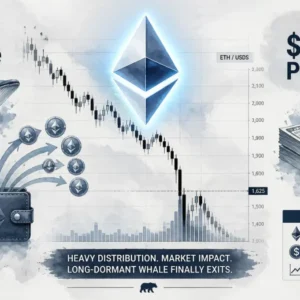
TRON is showing strong momentum, currently trading around $0.328, up over 15% year-to-date, outperforming much of the broader market. In contrast, Ethereum is trading near $2,316, down roughly 21% YTD, highlighting TRX’s relative strength in recent sessions.
This divergence suggests capital rotation into select altcoins, with Tron emerging as one of the stronger performers amid mixed market conditions.
Tron Inc. Expands TRX Treasury Holdings
In a notable development on 24 April, Tron Inc. (NASDAQ: TRON) has added to its holdings, acquiring 152,162 TRX tokens at an average price of $0.3286.
This latest purchase brings the company’s total TRX treasury to over 693 million tokens, reinforcing its long-term commitment to the ecosystem. The firm has stated its intention to continue growing its Tron Digital Asset Treasury (DAT), aiming to enhance long-term shareholder value.
Such accumulation reflects rising confidence in TRX’s future and adds a strong fundamental backing to the ongoing price action.
Double Bottom Breakout Confirmed
From a technical perspective, TRX has now confirmed a double bottom breakout, a classic bullish reversal pattern.
As highlighted in our previous TRON analysis, TRX successfully broke above the key neckline at $0.32082, which acted as major resistance. Following the breakout, the price rallied to a local high of $0.3367 before seeing a slight pullback.
This structure signals a shift in momentum from bearish to bullish, with buyers now stepping in at higher levels.
What’s Next for TRX?
The current setup suggests that TRX may enter a continuation phase, but the next move will depend on how price behaves around the breakout zone.
Bullish Scenario:
TRX could retest the breakout level near $0.32082 as support. If this level holds and the price manages to reclaim the recent high of $0.3367, it could trigger further upside toward the $0.37090 target, representing roughly 13% potential gains from current levels.
Bearish Scenario:
On the downside, failure to hold the breakout zone between $0.3180 and $0.32082 would weaken the bullish structure. A breakdown below this region could invalidate the setup and lead to short-term consolidation or deeper retracement.
Bottom Line
TRON is showing a strong combination of technical breakout and growing accumulation, while also outperforming major assets like Ethereum in recent performance.
With the double bottom pattern now confirmed, the focus shifts to whether TRX can hold its breakout support and build momentum for a move toward $0.37.
If bulls maintain control, the current setup could mark the beginning of a broader upward trend.
FAQ Section
Why is TRON (TRX) rising today?
TRX is gaining momentum due to strong technical breakout signals and continued accumulation by Tron Inc., boosting investor confidence.
What is the double bottom pattern in TRX?
It’s a bullish reversal pattern where price forms two lows and breaks above a neckline (here at $0.32082), signaling potential upside.
What is the next target for TRX price?
If momentum continues, TRX could move toward $0.3709, which is the measured move target from the breakout.
What level invalidates the bullish setup?
A drop below the $0.3180–$0.32082 support zone would weaken the breakout and may lead to further consolidation.
How is TRX performing compared to Ethereum?
TRX has shown relative strength recently, gaining while Ethereum has faced notable declines, highlighting short-term outperformance.
The opinions and market insights shared on CoinsProbe represent the views of individual authors based on prevailing market conditions at the time of publication. Cryptocurrency investments carry significant risk and volatility. Readers are encouraged to conduct their own research and seek professional financial advice before making investment decisions. CoinsProbe and its contributors do not accept responsibility for financial losses or decisions made based on published content.
CoinsProbe may publish sponsored articles, affiliate links, or promotional collaborations. All sponsored material is clearly labeled to maintain transparency with our audience. Our editorial decisions remain fully independent, and advertising partnerships do not influence reviews, rankings, or published opinions.
Since 2023, CoinsProbe has delivered reliable insights on cryptocurrency, blockchain, and digital assets. Our content is created by experienced researchers and analysts who follow strict editorial standards focused on accuracy, transparency, and credibility. Every article is carefully reviewed and verified using trusted sources and current market data. We provide unbiased analysis and timely updates covering everything from emerging crypto projects to major industry developments.