
- Bitcoin has been consolidating within a tight $67K–$72K range for 7 days straight — a classic coiling structure that historically precedes a sharp directional move.
- Long Delta is quietly building at current levels, signalling that large buyers and institutions are absorbing supply — the same pattern that has preceded strong recoveries in past cycles.
- $68,946 is the line in the sand. A hold above the 50 MA and rising wedge support opens the path to $78K–$85K. A breakdown below it puts $60,061 directly in play.
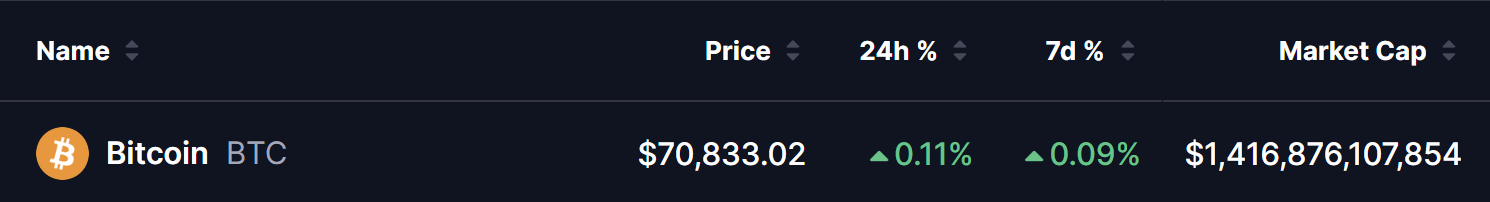
Bitcoin is currently trading at $70,833, virtually flat over the past 24 hours (+0.11%) and the past 7 days (+0.09%), with a market capitalisation of approximately $1.42 trillion. BTC has been grinding sideways within a tight range of $67,000–$72,000 over the last 7 days, reflecting extreme indecision in the market as participants await the next directional catalyst.
This prolonged consolidation is neither a sign of strength nor weakness in isolation — it is a coil being wound. Volume has compressed and price is being squeezed between two converging trendlines, a structure that typically precedes a high-velocity move in one direction.
Long Delta Building
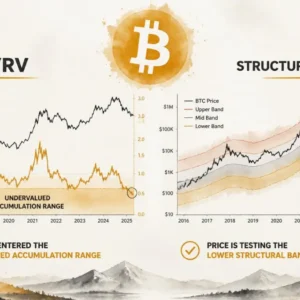
One of the most significant developments beneath the surface is the accumulation of Long Delta at current price levels. The BB Position Composite indicator (chart by analyst @MaxBecauseBTC) reveals a critical structural story across three key market phases:
- Phase 1 — Short Delta Dominant: Price was forming a lower high near the $110K–$120K zone. Short delta dominated — institutions and large players were distributing, not accumulating.
- Phase 2 — Continued Short Delta: Short delta persisted through the correction, confirming sustained selling pressure driving BTC from its ATH down toward the $80K–$85K zone.
- Phase 3 — Long Delta Emerging: At current levels (~$68K–$71K), Long Delta is clearly building. This signals that large buyers are beginning to absorb supply — a potential precursor to a directional shift.
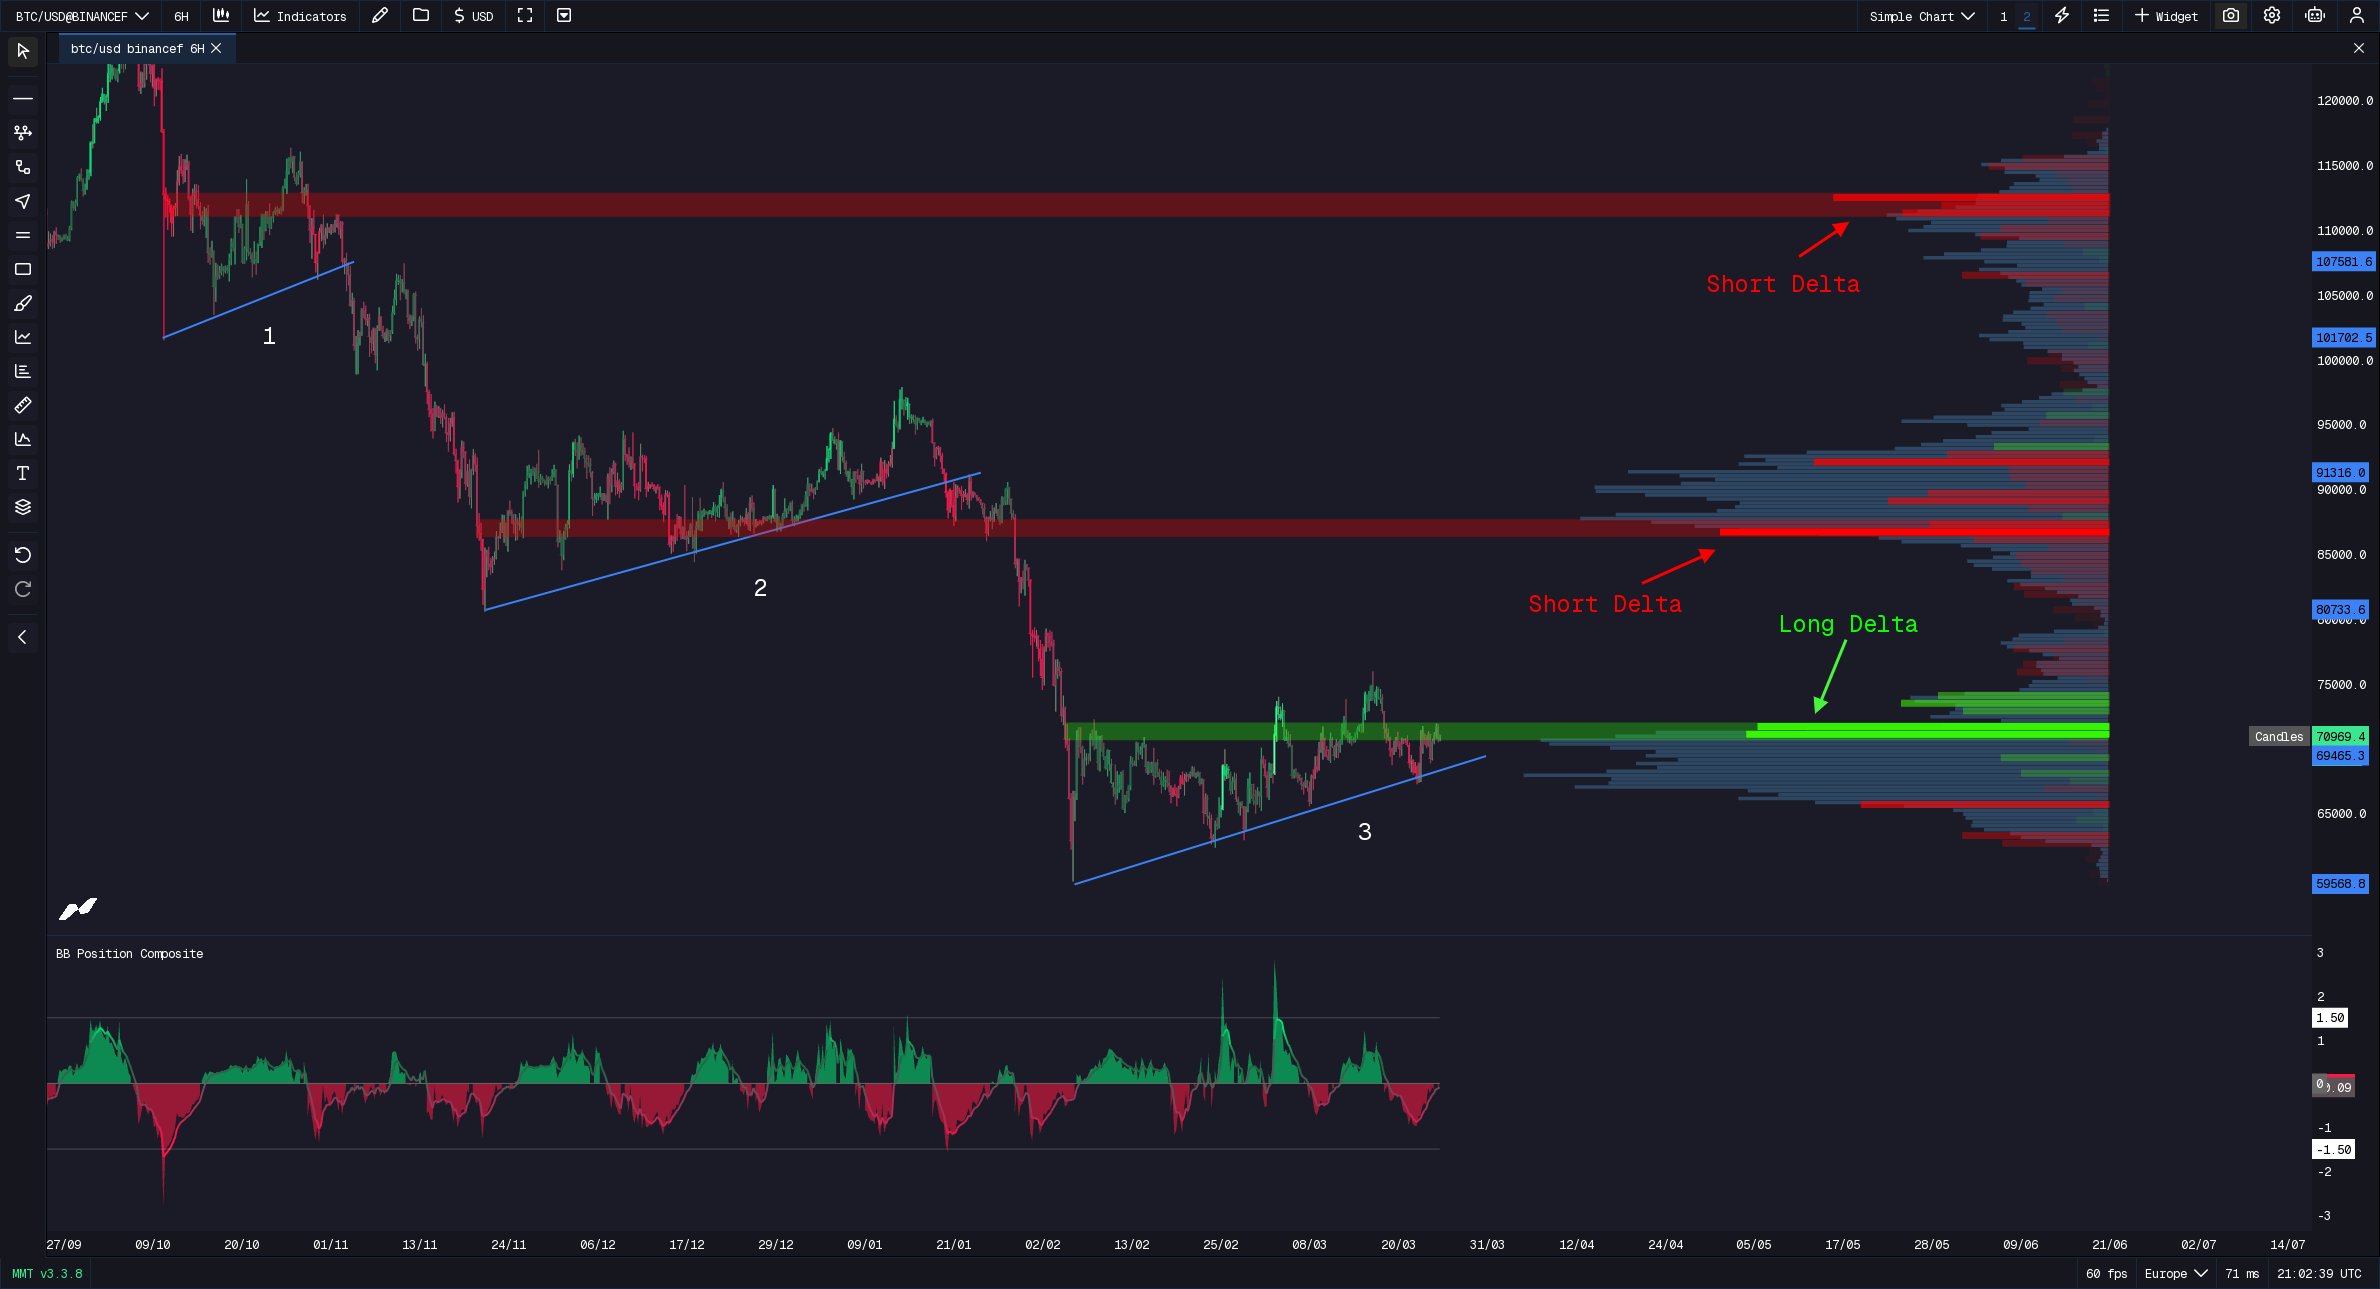
Historically, this type of long delta build-up at a major support confluence has preceded strong recoveries. However, it is a confirmation signal — not a guarantee. The long delta must hold and continue to grow as price tests its support.
Descending Channel Pattern
The macro structure on the daily chart tells a clear story of a correction unfolding inside a descending channel, with a series of rising wedge breakdowns accelerating each leg lower:
ATH at $126,213: The correction began from the all-time high set in late 2025, with the descending channel forming as the primary macro structure.
Rising Wedge Breakdowns: Within the descending channel, BTC has repeatedly formed rising wedges — bear-flag-like structures — which have each broken down sharply, confirming the continuation of the corrective phase. Each breakdown was further confirmed by BTC losing its 50-day moving average, adding structural weight to the bearish momentum.
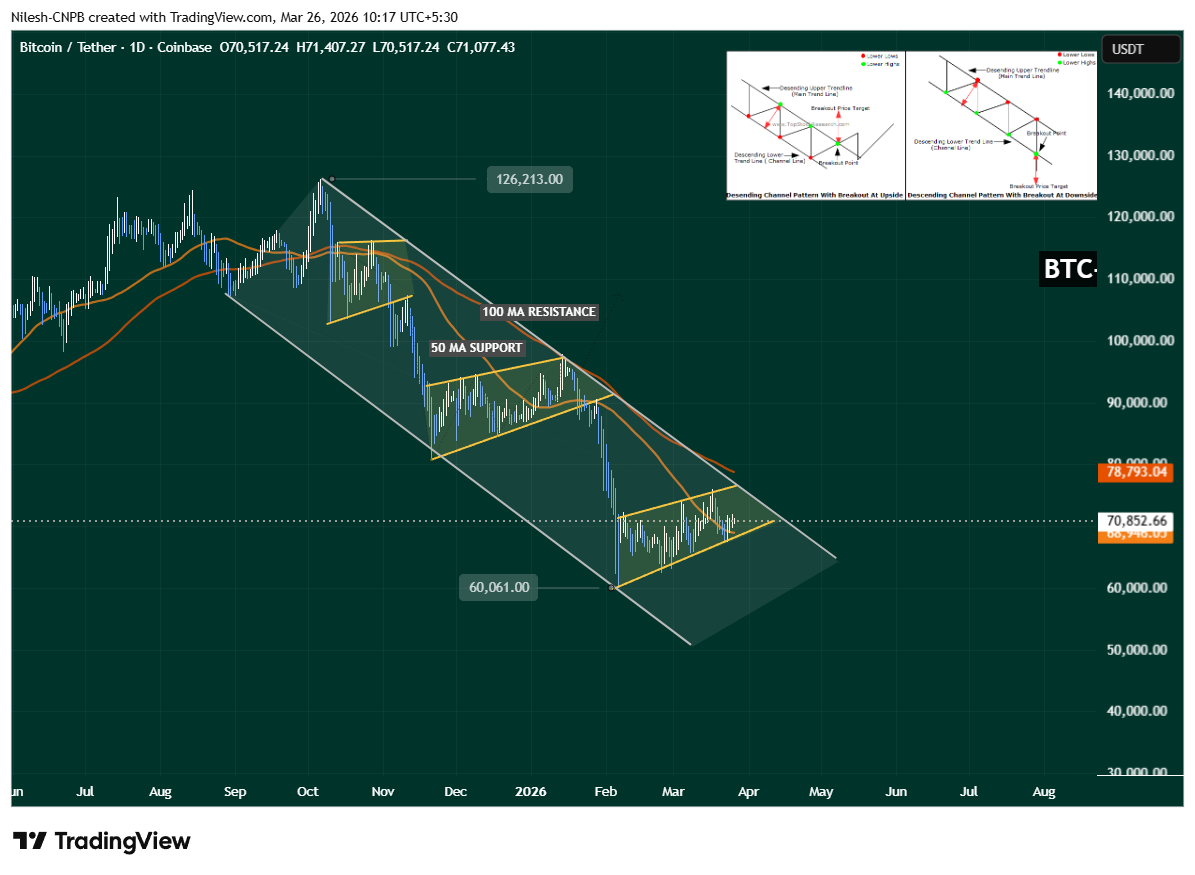
Current Position: BTC is now consolidating in a fresh rising wedge within the descending channel, with price holding above both the wedge support trendline and the 50 MA near $68,946. The $60,061 level — the channel’s lower boundary and a prior swing low — represents the next major support if the current structure fails.
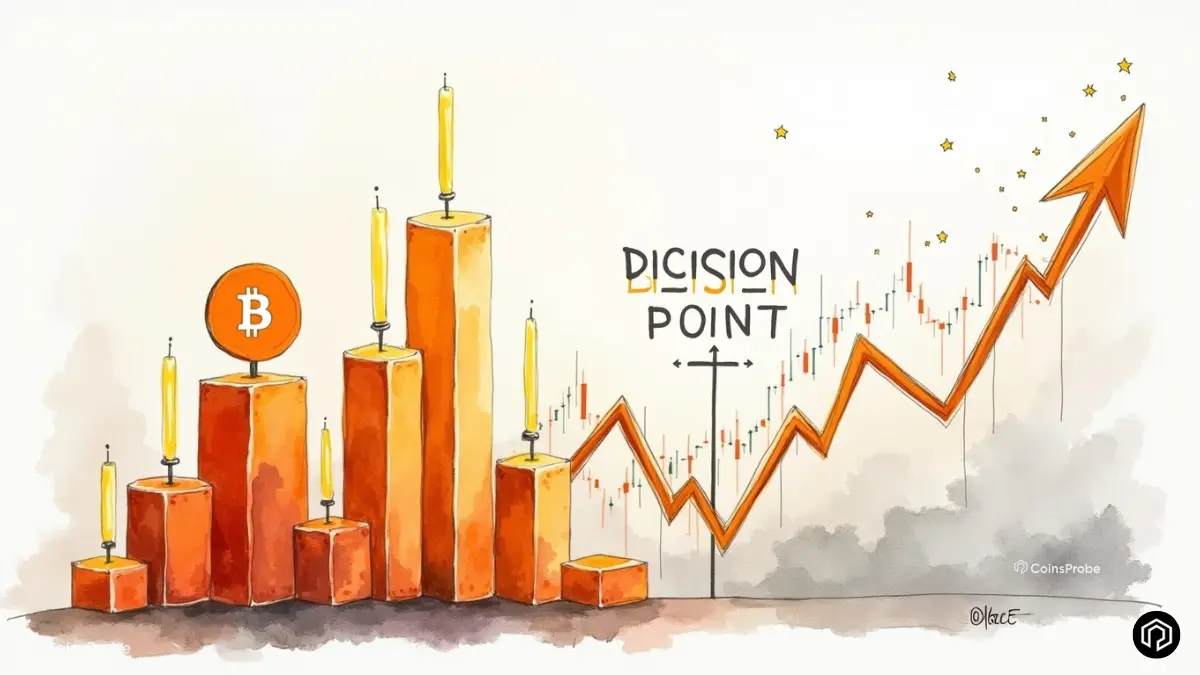
BTC is sitting at exactly this inflection point — a descending channel breakout to the upside or a fresh breakdown to the downside. Both scenarios are live.
What’s Next for BTC?
Bitcoin stands at a critical crossroads. The long delta building and the 50 MA / wedge support holding are the key variables to monitor.
Bullish Scenario
- Condition: Price holds above $68,946 (50 MA) and the rising wedge support trendline.
- Catalyst: Long delta continues to build, confirming buyer absorption at current levels.
- Target: Bullish breakout above the descending channel — potential move toward the $78K–$85K zone.
Bearish Scenario
- Condition: Failure to hold $68,946 and a breakdown below the rising wedge support trendline.
- Catalyst: Another rising wedge breakdown within the descending channel triggers fresh selling pressure.
- Target: Next key support near $60,061 — the previous major swing low and lower channel boundary.
As we have consistently noted at Coinsprobe — and as Outset Media Index recently confirmed with 12 years of data — it is not the news that moves the market first. It is the positioning, the structure, and the smart money. The long delta building beneath current prices is proof of exactly that. Whether a recovery follows depends entirely on BTC holding its structural floor. Stay disciplined, manage risk, and watch the key levels — Nilesh | Coinsprobe.
The opinions and market insights shared on CoinsProbe represent the views of individual authors based on prevailing market conditions at the time of publication. Cryptocurrency investments carry significant risk and volatility. Readers are encouraged to conduct their own research and seek professional financial advice before making investment decisions. CoinsProbe and its contributors do not accept responsibility for financial losses or decisions made based on published content.
CoinsProbe may publish sponsored articles, affiliate links, or promotional collaborations. All sponsored material is clearly labeled to maintain transparency with our audience. Our editorial decisions remain fully independent, and advertising partnerships do not influence reviews, rankings, or published opinions.
Since 2023, CoinsProbe has delivered reliable insights on cryptocurrency, blockchain, and digital assets. Our content is created by experienced researchers and analysts who follow strict editorial standards focused on accuracy, transparency, and credibility. Every article is carefully reviewed and verified using trusted sources and current market data. We provide unbiased analysis and timely updates covering everything from emerging crypto projects to major industry developments.