
As of March 11, 2026, Bitcoin is trading around $69,553, showing a modest 0.11% gain over the past 24 hours. During the session, BTC briefly climbed to a 24-hour high of $71,770 before facing selling pressure.
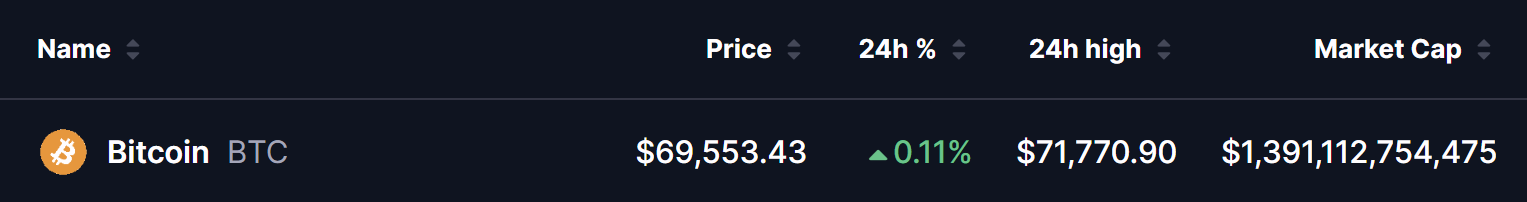
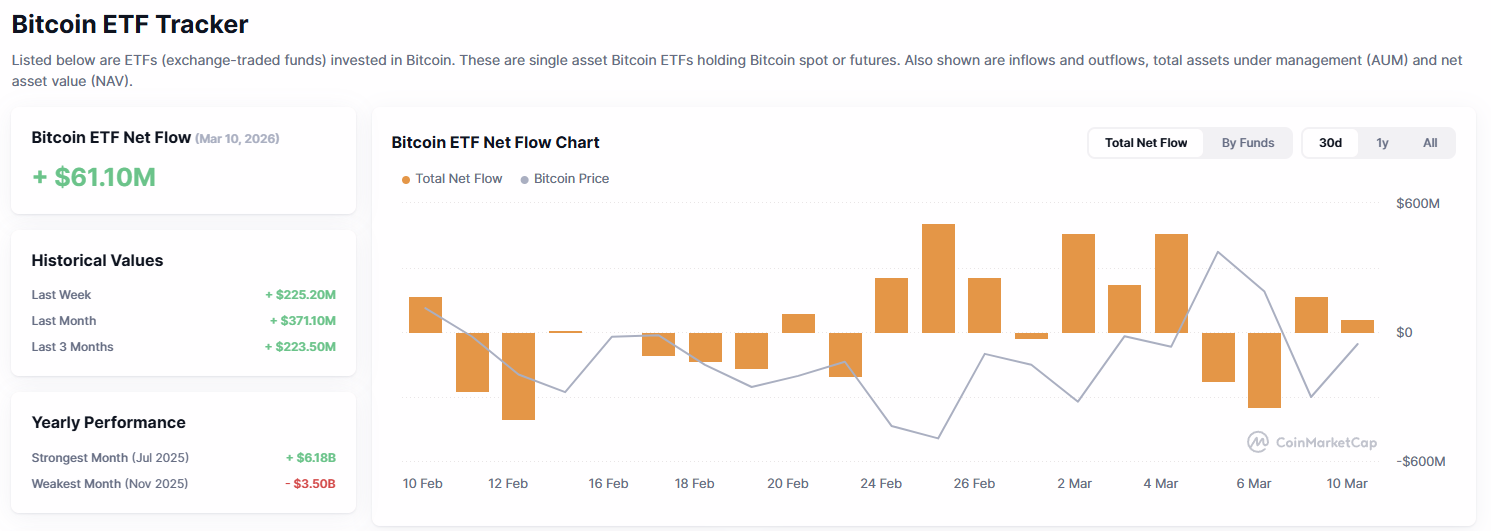
Despite heightened volatility linked to the ongoing U.S.–Iran conflict, Bitcoin continues to trade within a broad $65,000–$72,000 range, with its market capitalization hovering near $1.39 trillion. Recent positive net inflows into Bitcoin ETFs, totaling $228 million in the first two days of the week, according to CoinMarketCap, point to renewed institutional interest and suggest that large investors may be accumulating BTC amid geopolitical uncertainty.
If this trend continues, the latest technical developments could potentially support a rebound in Bitcoin’s price.
Oversold RSI Signals Potential Recovery
According to data shared by analyst @cryptorand, Bitcoin’s behavior following these oversold events has shown a fairly consistent pattern when examining the last five instances of RSI dropping below 30.
The chart highlights that Bitcoin typically experiences continued weakness immediately after the oversold signal, often forming a deeper local bottom within the following days. However, once the market stabilizes, a recovery phase tends to follow.
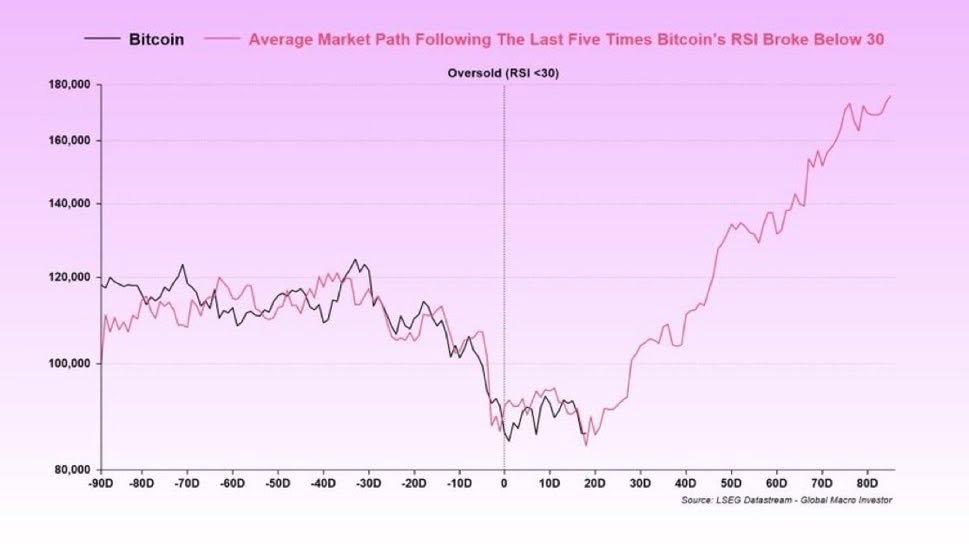
Historically, the average market path after these oversold conditions shows Bitcoin gradually regaining momentum and moving into a sustained upward trend over time. In several past cycles, this recovery eventually led to strong bullish expansions in the months that followed.
While historical patterns do not guarantee future performance, the chart suggests that RSI dips below 30 have often appeared near major accumulation zones, making them important signals that traders closely monitor for potential market reversals.
Based on previous trends, such conditions have marked the early stages of extended upward moves in Bitcoin’s price.
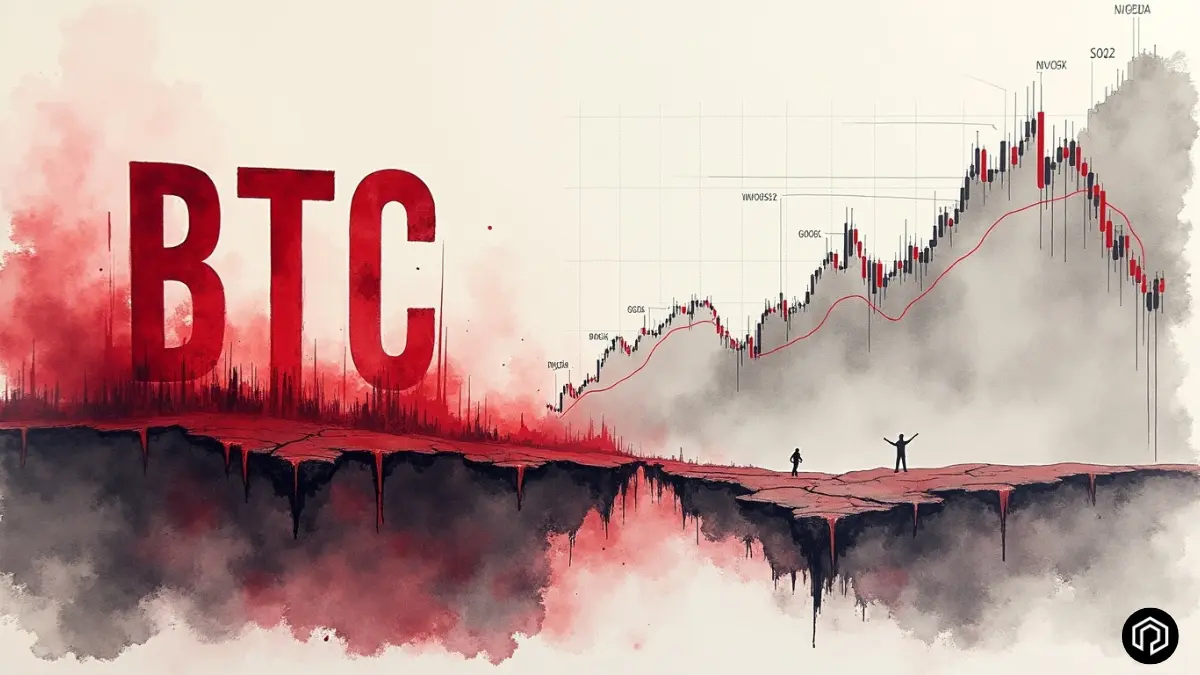
Bitcoin Fractal Compared With NVIDIA and Google
Another perspective comes from analyst @OVcrypto, who highlights a fractal similarity between Bitcoin and major technology stocks such as NVIDIA (NVDA) and Alphabet (GOOG).
In each case, the assets followed a similar market structure:
- A multi-year bullish trend
- A significant corrective phase
- A retest of the 200-week simple moving average (SMA)
- A recovery leading to new highs
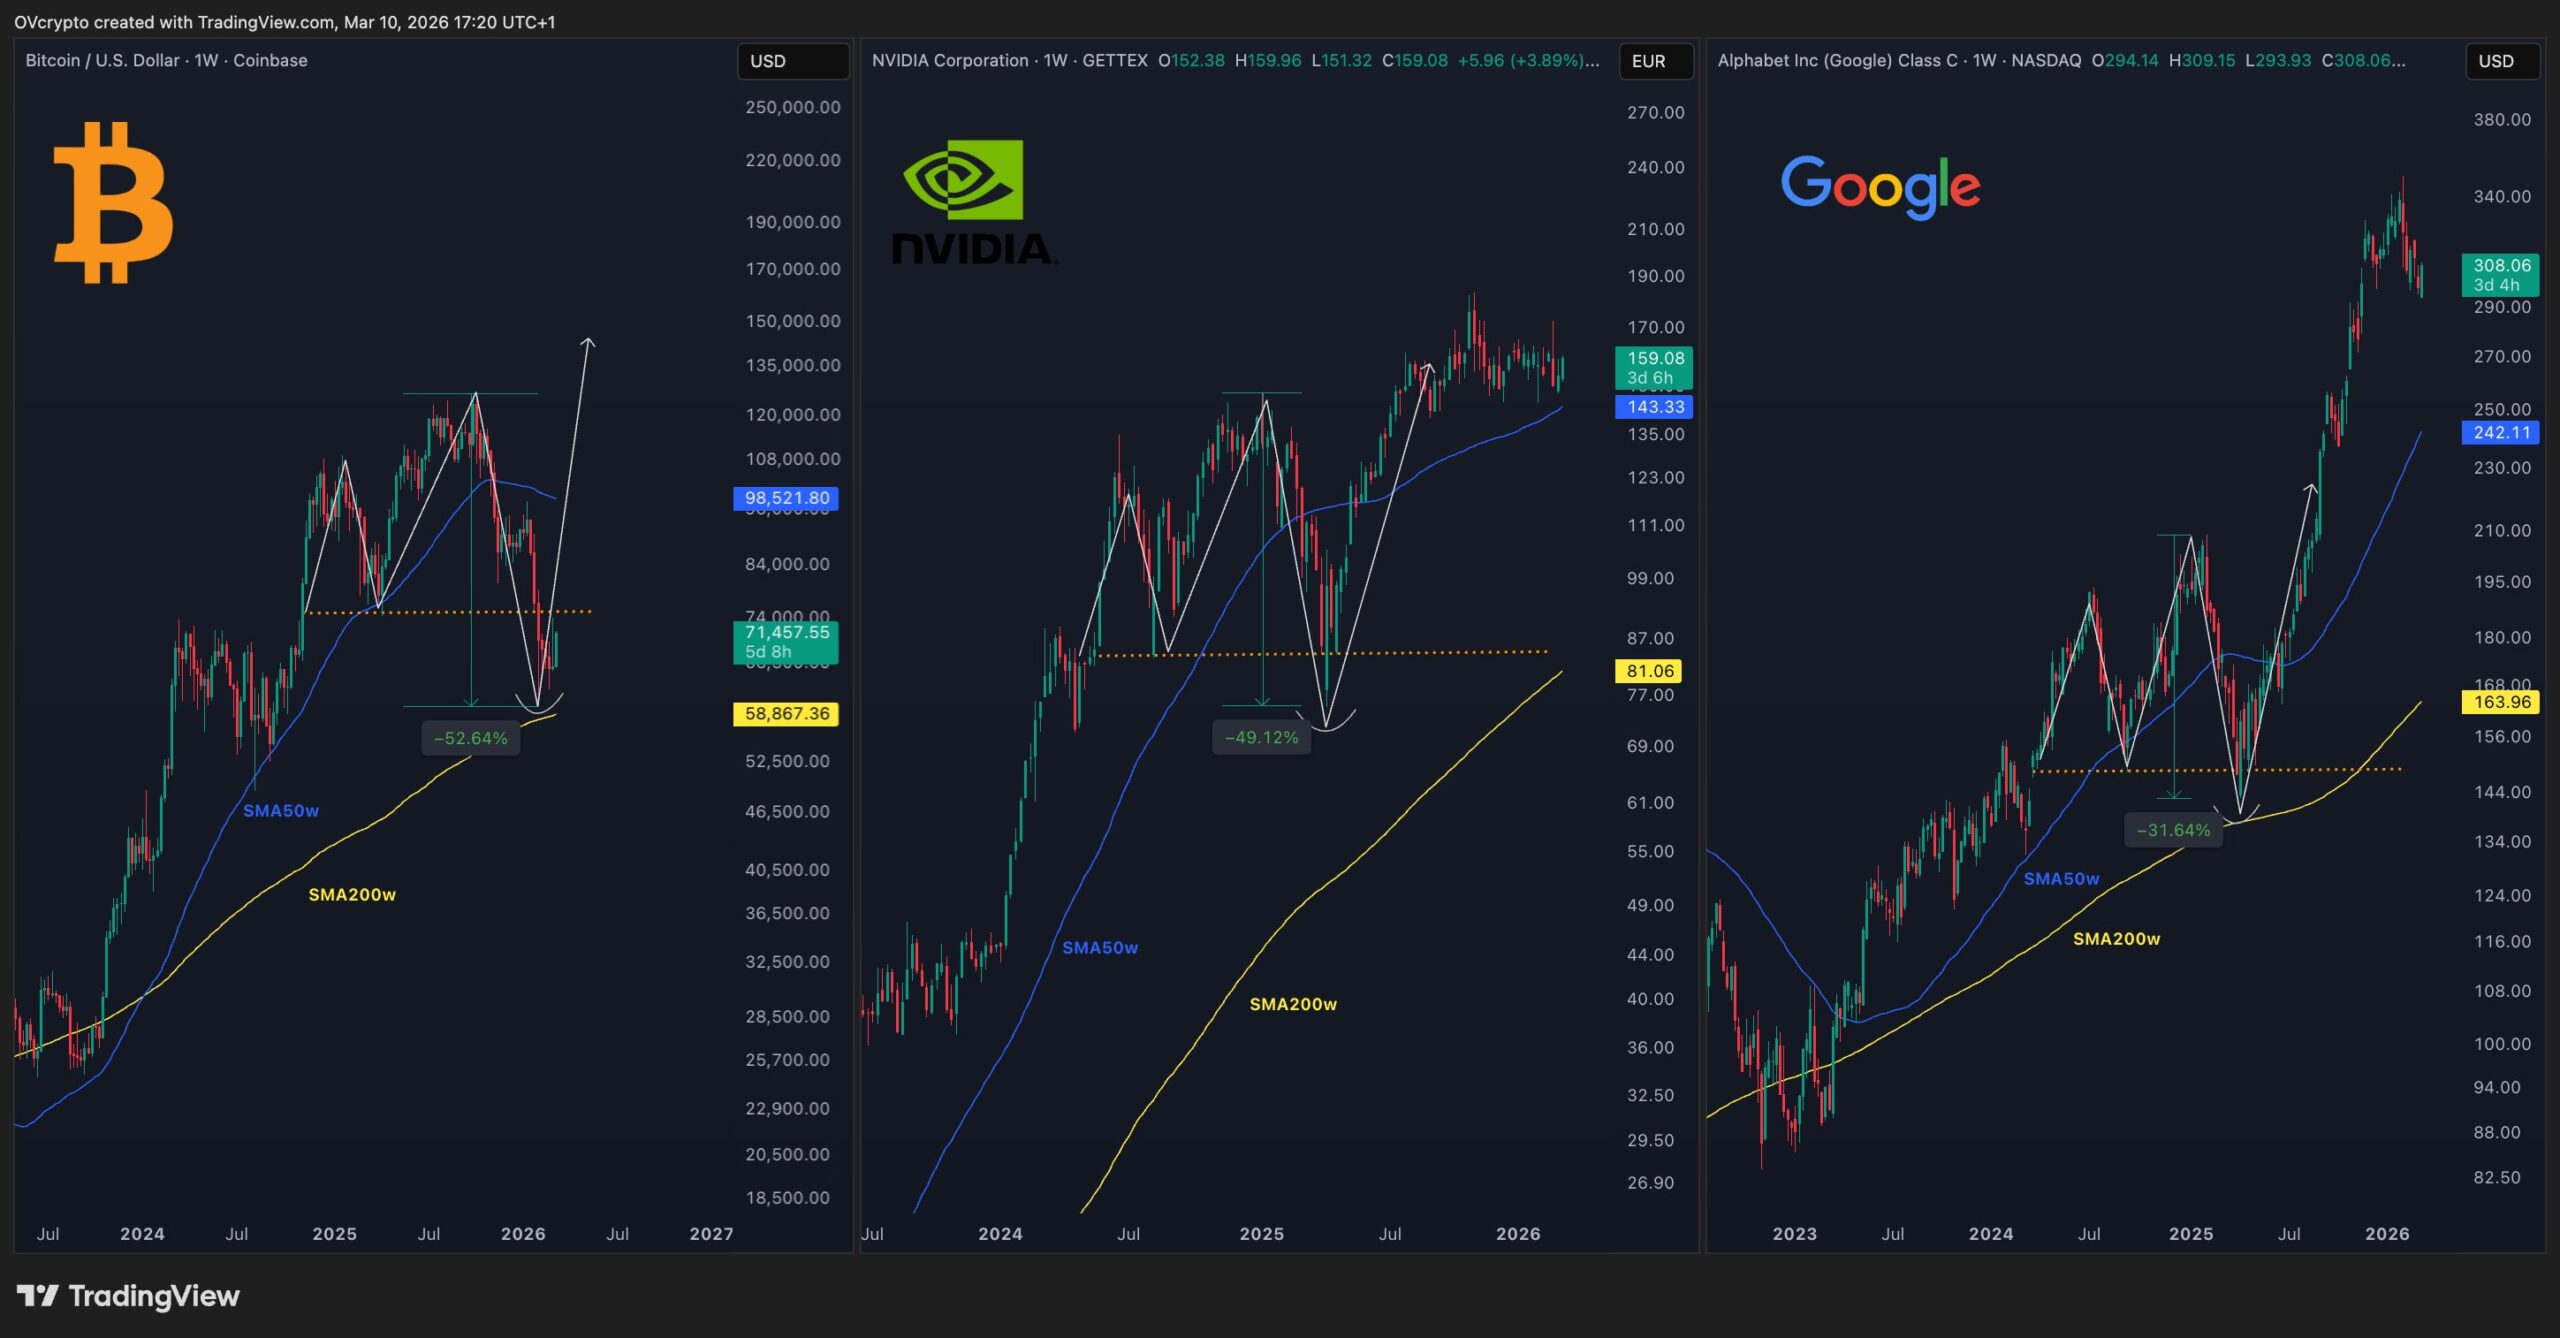
Bitcoin recently experienced a major correction of more than 50% from local highs, briefly testing long-term support near the 200-week moving average before stabilizing. Comparable patterns were seen in NVIDIA and Google, which later resumed their upward trends after similar corrections.
If Bitcoin continues to follow this fractal structure, it could indicate the potential for a renewed upward phase in the coming cycles, supported by factors such as institutional adoption, ETF demand, and the long-term impact of Bitcoin halvings.
Outlook
While these technical signals offer encouraging signs, they do not guarantee future performance. Market conditions, macroeconomic factors, and investor sentiment will continue to influence Bitcoin’s trajectory.
Still, the combination of historical RSI recovery patterns and long-term fractal similarities suggests that Bitcoin may be approaching a critical phase that could shape the next stage of the market cycle.
Investors should continue monitoring key technical levels and broader market developments as Bitcoin navigates this period of consolidation.
FAQ
What does an oversold RSI mean for Bitcoin?
An oversold RSI occurs when the Relative Strength Index drops below 30. This typically indicates strong selling pressure and may signal that Bitcoin is approaching a potential price rebound.
Has Bitcoin historically rallied after an oversold RSI?
Yes. In several past market cycles, Bitcoin has seen notable recoveries after the RSI entered oversold territory, although short-term volatility often occurs before the rebound begins.
What are bullish fractals in crypto charts?
Bullish fractals refer to repeating price patterns observed in previous market cycles. Traders use them to identify potential future price movements based on historical chart structures.
Could Bitcoin follow similar patterns to tech stocks like NVIDIA or Google?
Some analysts have observed fractal similarities between Bitcoin and major tech stocks such as NVIDIA and Google, where long-term corrections were followed by strong rallies after key moving averages were reclaimed.
The opinions and market insights shared on CoinsProbe represent the views of individual authors based on prevailing market conditions at the time of publication. Cryptocurrency investments carry significant risk and volatility. Readers are encouraged to conduct their own research and seek professional financial advice before making investment decisions. CoinsProbe and its contributors do not accept responsibility for financial losses or decisions made based on published content.
CoinsProbe may publish sponsored articles, affiliate links, or promotional collaborations. All sponsored material is clearly labeled to maintain transparency with our audience. Our editorial decisions remain fully independent, and advertising partnerships do not influence reviews, rankings, or published opinions.
Since 2023, CoinsProbe has delivered reliable insights on cryptocurrency, blockchain, and digital assets. Our content is created by experienced researchers and analysts who follow strict editorial standards focused on accuracy, transparency, and credibility. Every article is carefully reviewed and verified using trusted sources and current market data. We provide unbiased analysis and timely updates covering everything from emerging crypto projects to major industry developments.