
South Korean liquidity may be rotating from stocks back into crypto. Over four months, the KOSPI surged 80% while Bitcoin fell 52%. Now the trend reversed: KOSPI down 18%, Bitcoin up 11% in just five days. Is capital flowing from Korean equities into cryptocurrency? The evidence is compelling but correlation doesn’t prove causation.
KOSPI Index Collapse: What Happened
The KOSPI fell 18% in just two days—the steepest decline on record. Foreign investors dumped $13.7 billion in February (the largest monthly outflow ever), with selling accelerating in early March as US-Iran tensions escalated. The KOSPI Volatility Index hit 2008 crisis levels, while the Korean won dropped its largest single-day amount against the dollar since 2009.
High margin debt amplified losses. During the 80% rally, South Korean retail investors accumulated unprecedented leverage while $54 billion flooded into domestic ETFs. When selling began, margin calls triggered cascading liquidations. Heavy concentration in semiconductors magnified volatility, and Korean exporters’ vulnerability to Middle East disruptions added pressure. Currency weakness deterred remaining foreign investors from holding Korean stocks.
KOSPI vs Bitcoin Price Divergence
Market analyst @BullTheoryio shared a TradingView chart on X overlaying the KOSPI’s performance against Bitcoin, revealing a striking divergence that has captured investor attention. The chart tells a compelling story through technical comparison.
The chart shows the KOSPI’s dramatic 80% surge over four months, followed by its recent 18% collapse. Overlaid against this is Bitcoin’s performance: a 52% decline during the same rally period, followed by an 11% surge over the last five days. This inverse relationship—KOSPI climbing while BTC fell, then KOSPI crashing while BTC rallied—suggests capital may be shifting from one market to the other.
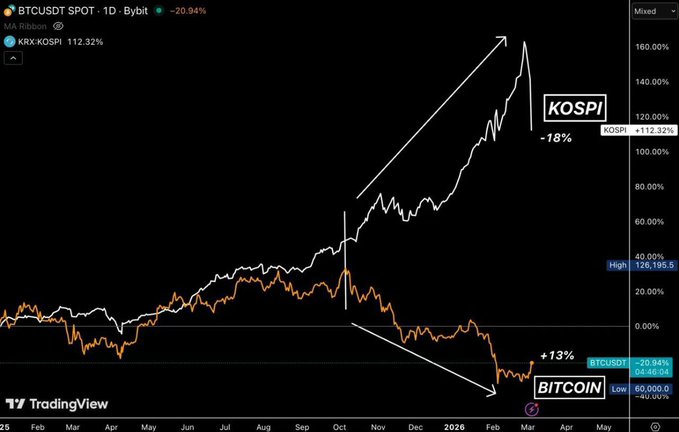
The correlation becomes more striking when you examine the timing. The chart clearly shows that as foreign investors began exiting Korean equities in February ($13.7 billion) and the selling accelerated in early March, Bitcoin simultaneously bottomed near $60,000 and began a sharp recovery. This temporal alignment has led analysts to propose the capital rotation thesis: investors liquidating Korean equity positions are moving capital into cryptocurrency.
However, important caveats apply. While the correlation is visually compelling, it doesn’t prove causation. Bitcoin’s $75 billion daily trading volume and $1.4 trillion market cap are enormous relative to the $8-13 billion in Korean equity outflows. Can flows of that magnitude meaningfully drive Bitcoin’s price movements? Alternatively, Bitcoin may have rallied due to independent technical factors, broader geopolitical concerns about Middle East conflicts, or global risk sentiment shifts entirely unrelated to Korean markets.
Bitcoin Market Maker Buy Model (MMBM) Formation
Trader Ezekiel (duje_matic) shared a detailed daily Bitcoin chart on March 4, 2026, capturing a textbook Market Maker Buy Model (MMBM) formation—a pattern popularized in Smart Money and ICT (Inner Circle Trader) trading circles.
The chart reveals a classic MMBM structure unfolding across Bitcoin’s daily timeframe from mid-2025 through early March 2026. After Bitcoin rallied to approximately $130,000 in late 2025, price collapsed sharply into a $60,000-$70,000 demand zone marked in red on the chart. This represents the manipulation phase of the MMBM, where institutional traders engineer false breakdowns to accumulate positions cheaply.
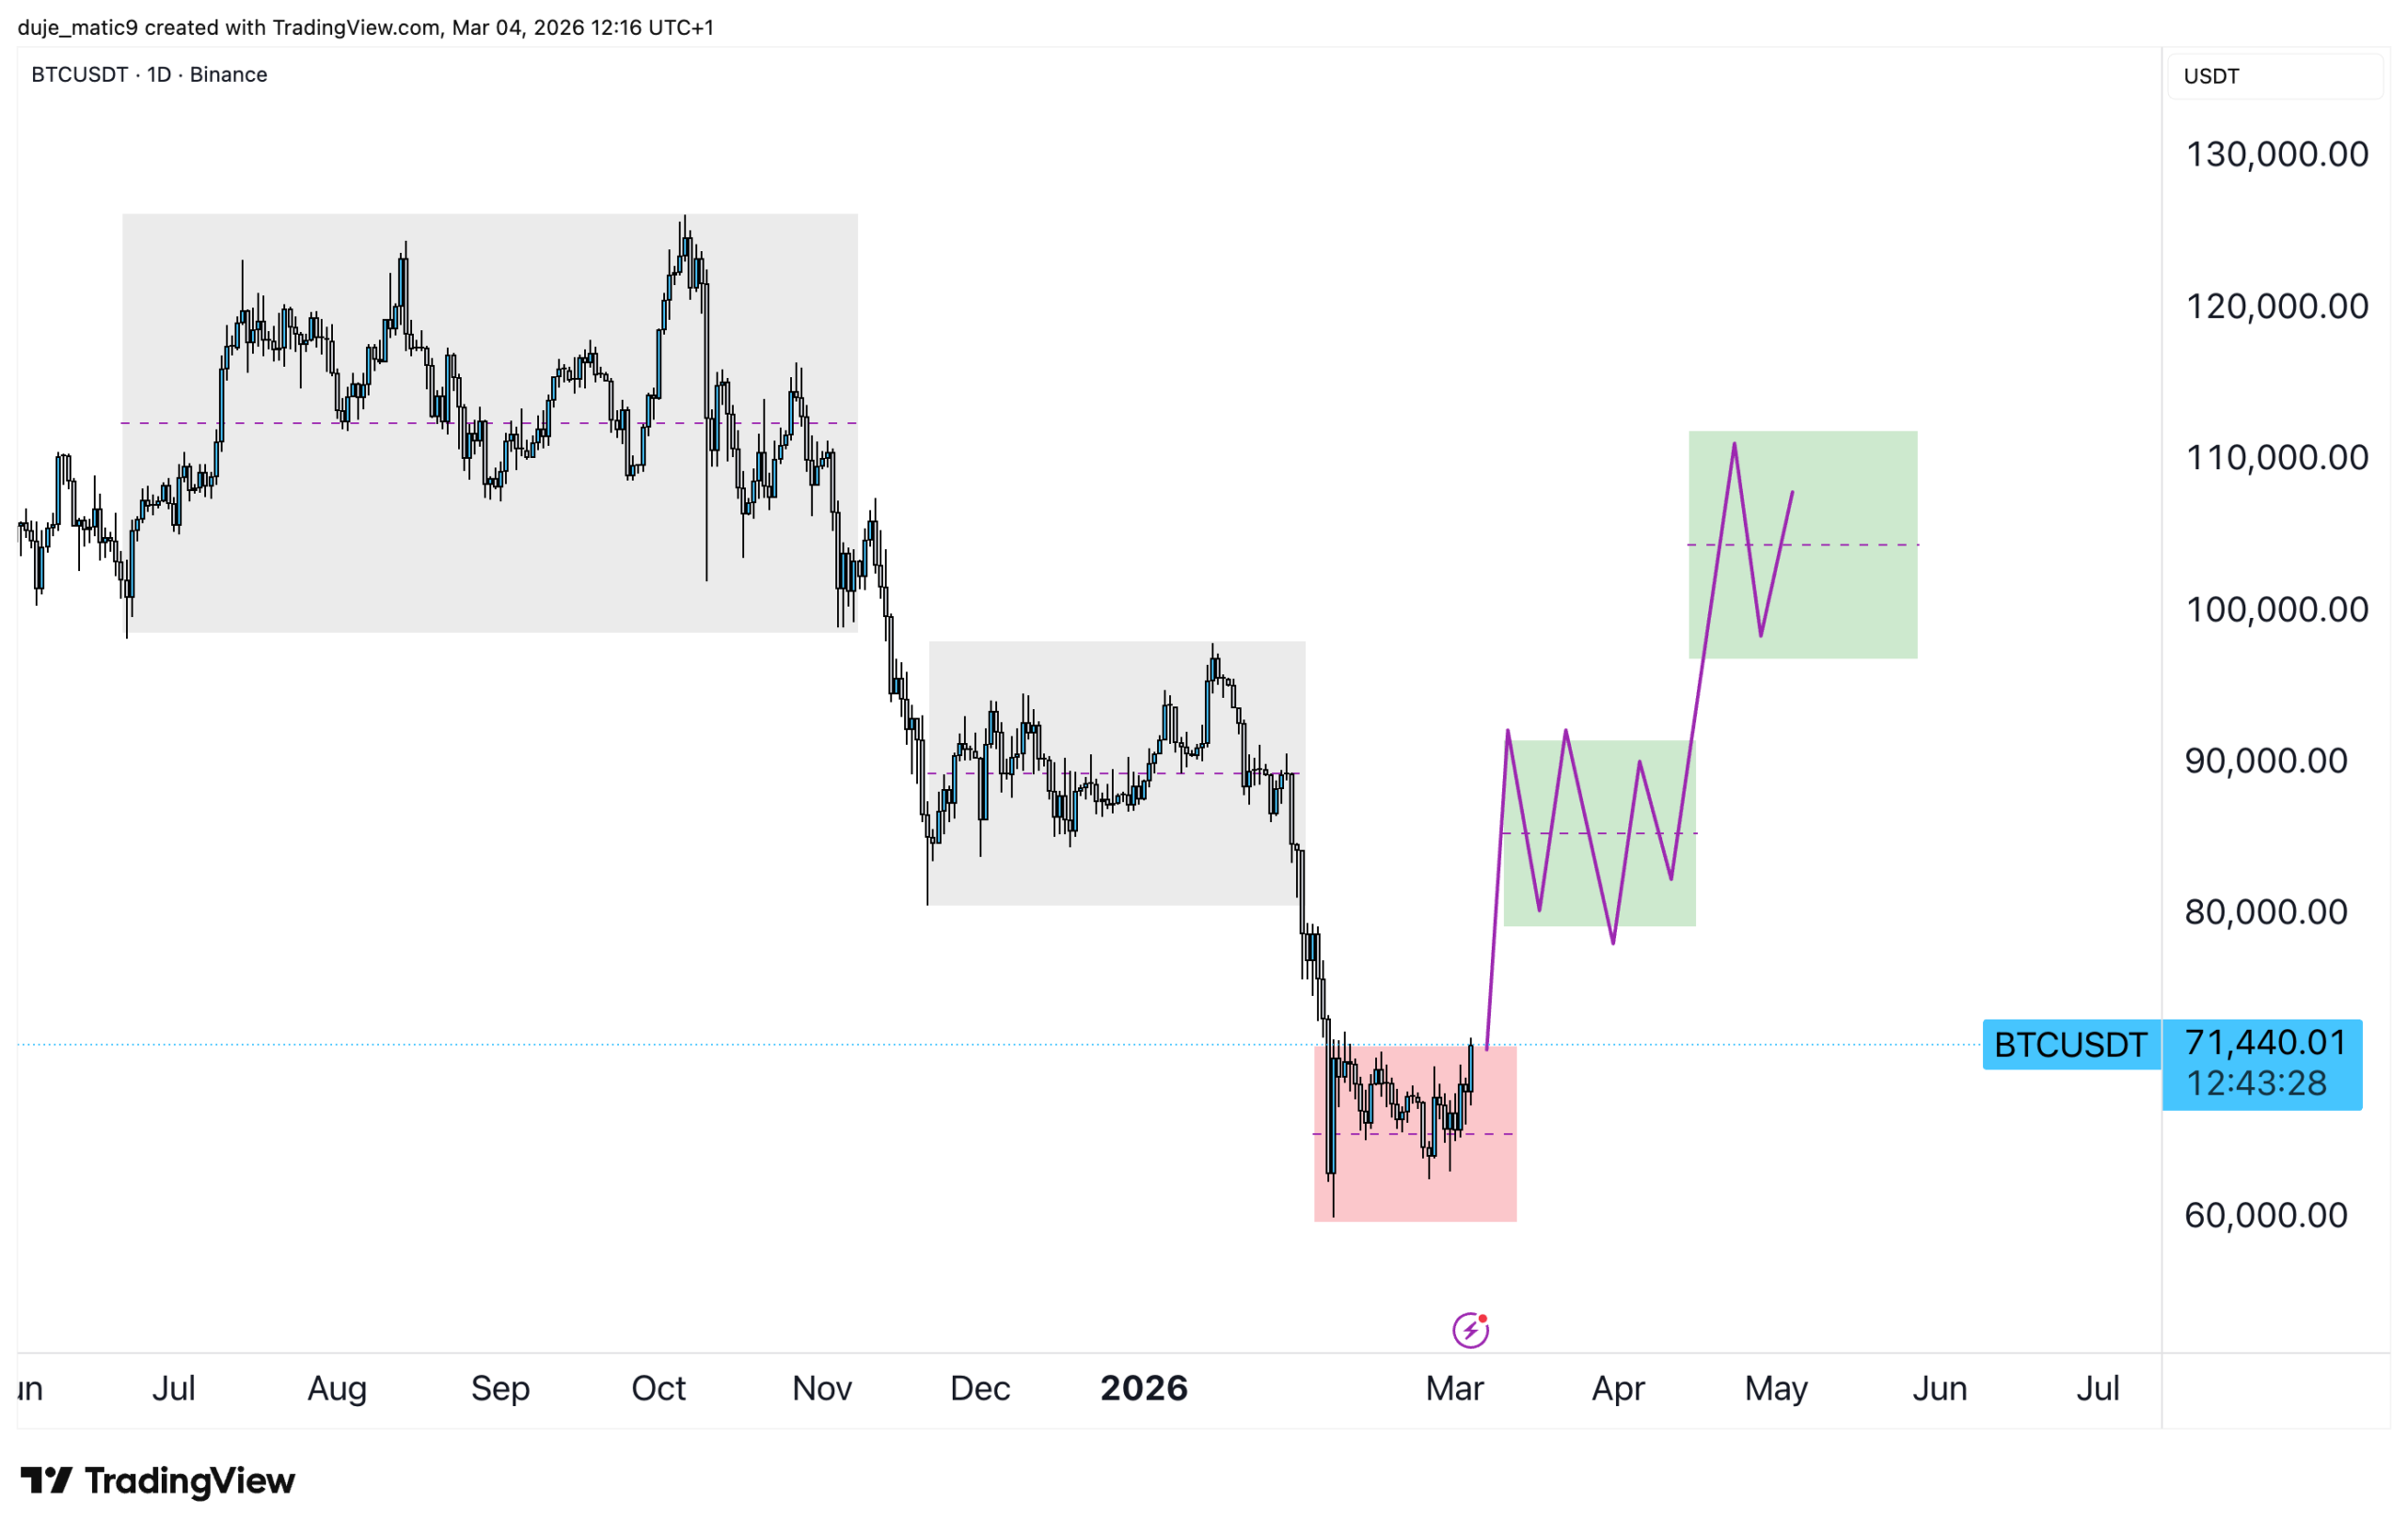
The sharp wick lower into the $60,000 level followed by strong bullish candles represents a textbook inducement or liquidity sweep—the hallmark of smart money accumulation. This false breakdown trapped late short sellers and swept sell-side liquidity before the reversal.
From the March low near $60,000, Bitcoin delivered aggressive upward displacement, breaking structure with higher highs and higher lows. The green zones on the chart mark potential expansion legs, with Bitcoin currently trading around $72,300 (as of March 5, 2026). This aligns with the bullish “right-hand side” of the MMBM model—post-manipulation accumulation has transitioned into bullish displacement.
The chart suggests Bitcoin is entering a higher-timeframe bullish regime after a classic manipulation phase. If this structure plays out fully, Bitcoin could target previous highs around $100,000. The dashed purple lines likely represent key internal/external range liquidity levels that smart money respected before the breakout.
Is This Capital Rotation Confirmed? What Investors Need to Know
The KOSPI-Bitcoin divergence combined with Bitcoin’s textbook MMBM technical setup creates an intriguing narrative about capital rotation. However, investors should treat this as a working hypothesis rather than confirmed fact. The coming weeks will reveal whether this represents genuine capital flight from Korean equities into cryptocurrency or an interesting but coincidental market correlation.
What we know: KOSPI crashed and BTC rallied. What we assume: Korean capital rotated to crypto. What we need: Confirmed evidence through exchange volumes, stablecoin flows, and sustained correlation patterns.
The opinions and market insights shared on CoinsProbe represent the views of individual authors based on prevailing market conditions at the time of publication. Cryptocurrency investments carry significant risk and volatility. Readers are encouraged to conduct their own research and seek professional financial advice before making investment decisions. CoinsProbe and its contributors do not accept responsibility for financial losses or decisions made based on published content.
CoinsProbe may publish sponsored articles, affiliate links, or promotional collaborations. All sponsored material is clearly labeled to maintain transparency with our audience. Our editorial decisions remain fully independent, and advertising partnerships do not influence reviews, rankings, or published opinions.
Since 2023, CoinsProbe has delivered reliable insights on cryptocurrency, blockchain, and digital assets. Our content is created by experienced researchers and analysts who follow strict editorial standards focused on accuracy, transparency, and credibility. Every article is carefully reviewed and verified using trusted sources and current market data. We provide unbiased analysis and timely updates covering everything from emerging crypto projects to major industry developments.