

Key Takeaways
- Ethereum ($ETH) has broken below the critical $2,637 support, signaling a shift in short-term market structure.
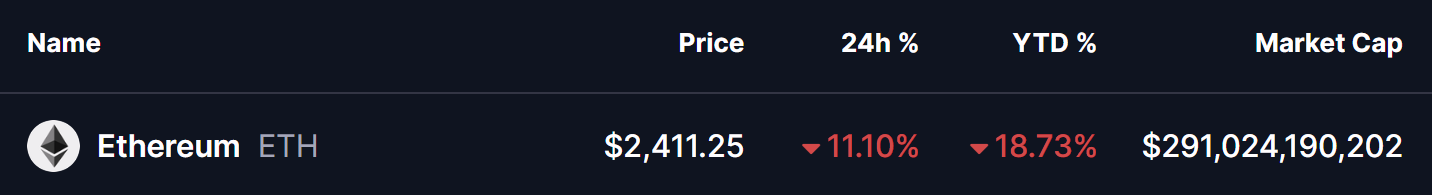
- Price is now trading near $2,400, posting an 11.10% daily loss and a 18% year-to-date decline.
- The current price action mirrors a bearish fractal from August 2024, raising the risk of further downside.
- If selling pressure persists, ETH could slide toward the $2,128 support zone, where buyers may attempt a defense.
Ethereum ($ETH), the second-largest cryptocurrency by market capitalization, is once again under heavy selling pressure. As of January 31, 2026, ETH has slipped near the $2,400 mark, printing an 11.10% decline in the last 24 hours and extending its year-to-date losses to 18.73%, while also marking a fresh yearly low.
The sharp move lower has shifted short-term sentiment firmly in favor of the bears, with both price structure and derivatives data flashing warning signs.
Liquidations Soar as Bulls Get Trapped
The downside move has been amplified by aggressive liquidations across the derivatives market. Recent data shows over $553 million worth of ETH positions liquidated, with a striking $523 million coming from long positions, compared to just $30 million in shorts over the past 24 hours.
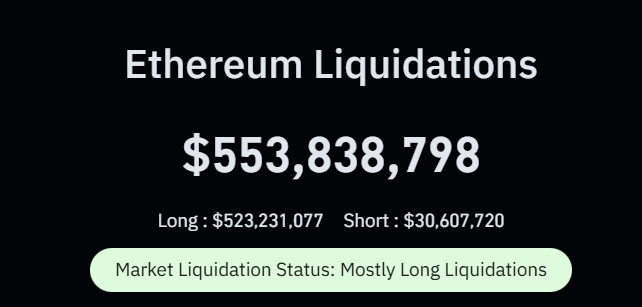
This imbalance highlights a classic scenario of over-leveraged bulls getting flushed out, where forced sell orders accelerate downside momentum. When liquidations skew this heavily toward longs, price often struggles to find immediate relief, as dip buyers hesitate and momentum traders press their advantage.
Bears Take Control on the Daily Chart
From a technical perspective, Ethereum’s daily chart paints a concerning picture. ETH has decisively lost the $2,637 horizontal support, a level that previously acted as a floor during consolidation. Once this zone gave way, selling pressure intensified, dragging price swiftly toward the $2,400 region.
What makes this move particularly notable is its resemblance to a previous downside fractal visible on the chart. Back in August 2024, ETH broke a similar support structure, triggering a sharp continuation move that ultimately drove price into a deeper corrective phase before buyers finally stepped in.
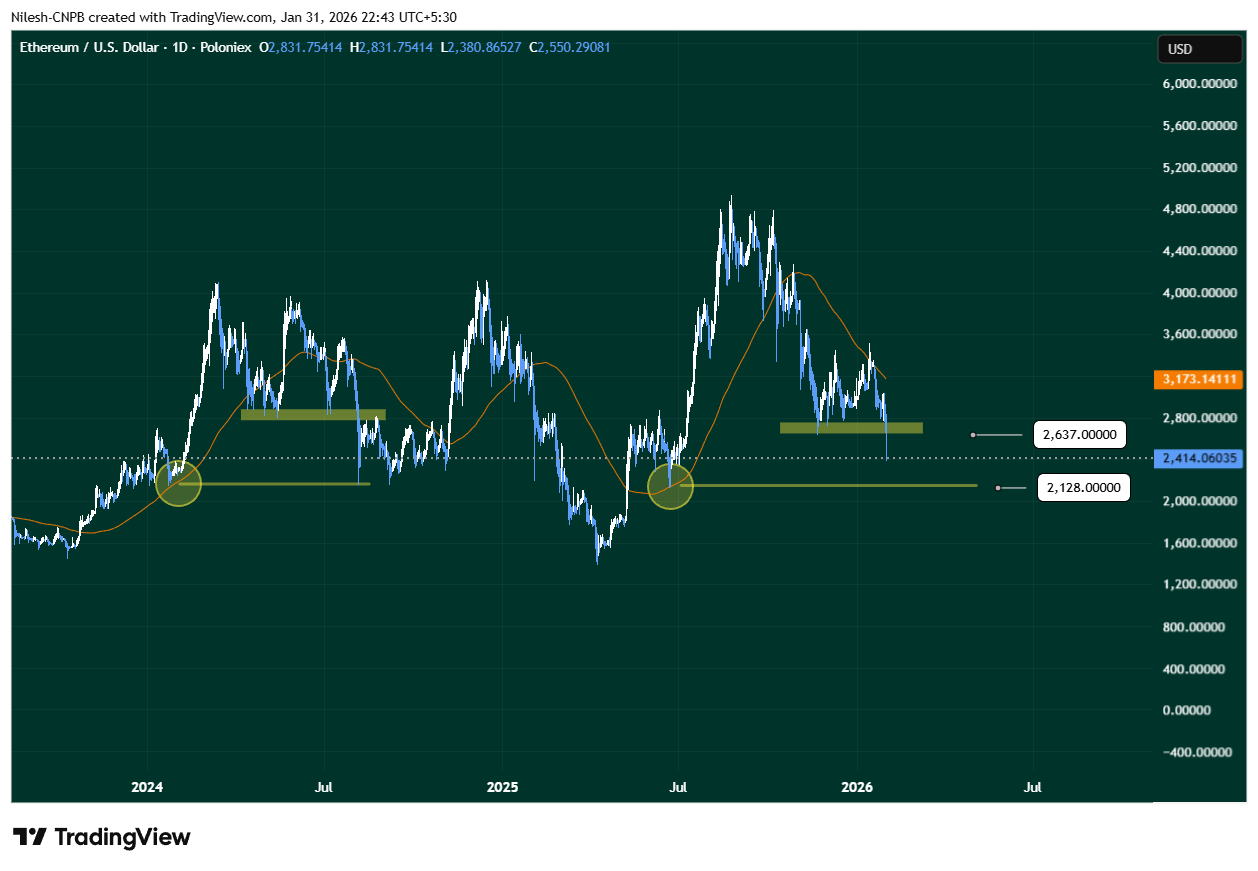
The current structure appears to be echoing that same behavior—support break, rapid downside expansion, and limited bounce attempts so far.
More Pain Ahead?
If this historical fractal continues to play out, Ethereum could be heading toward its next major support near $2,128, a zone that previously attracted strong demand. This level stands out as a potential area where longer-term buyers may begin to show interest, especially if broader market conditions stabilize.
On a flip side, a strong reclaim of the $2,637 resistance zone, followed by acceptance above it, would invalidate the current fractal setup and suggest that today’s breakdown was a false move. Such a recovery would likely force late shorts to cover and could stabilize price action.
For now, however, Ethereum remains vulnerable. With heavy long liquidations, broken support, and a familiar bearish pattern resurfacing on the chart, the path of least resistance appears tilted to the downside—at least in the short term.
Disclaimer: The views and analysis presented in this article are for informational purposes only and reflect the author’s perspective, not financial advice. Technical patterns and indicators discussed are subject to market volatility and may or may not yield the anticipated results. Investors are advised to exercise caution, conduct independent research, and make decisions aligned with their individual risk tolerance.
About Author: Nilesh Hembade is the Founder and Lead Author of Coinsprobe, with over 5 years of experience in the cryptocurrency and blockchain industry. Since launching Coinsprobe in 2023, he has been providing daily, research-driven insights through in-depth market analysis, on-chain data, and technical research.
The opinions and market insights shared on CoinsProbe represent the views of individual authors based on prevailing market conditions at the time of publication. Cryptocurrency investments carry significant risk and volatility. Readers are encouraged to conduct their own research and seek professional financial advice before making investment decisions. CoinsProbe and its contributors do not accept responsibility for financial losses or decisions made based on published content.
CoinsProbe may publish sponsored articles, affiliate links, or promotional collaborations. All sponsored material is clearly labeled to maintain transparency with our audience. Our editorial decisions remain fully independent, and advertising partnerships do not influence reviews, rankings, or published opinions.
Since 2023, CoinsProbe has delivered reliable insights on cryptocurrency, blockchain, and digital assets. Our content is created by experienced researchers and analysts who follow strict editorial standards focused on accuracy, transparency, and credibility. Every article is carefully reviewed and verified using trusted sources and current market data. We provide unbiased analysis and timely updates covering everything from emerging crypto projects to major industry developments.