

Key Takeaways
- Precious metals just saw a historic crash, with gold and silver wiping out trillions in value, while Ethereum is beginning to stabilize relative to gold.
- ETH/XAUT is holding a critical long-term support zone, suggesting the recent move may be consolidation rather than a bearish breakdown.
- A reclaim of the 50-week moving average could flip momentum bullish, opening the door for Ethereum to start outperforming gold in the coming cycle.
The commodity market just witnessed one of its most aggressive sell-offs in decades. In the last 24 hours alone, panic swept through precious metals following reports that President Trump has nominated Kevin Warsh — a former Federal Reserve governor known for his hawkish stance on inflation — as the next Fed chair.
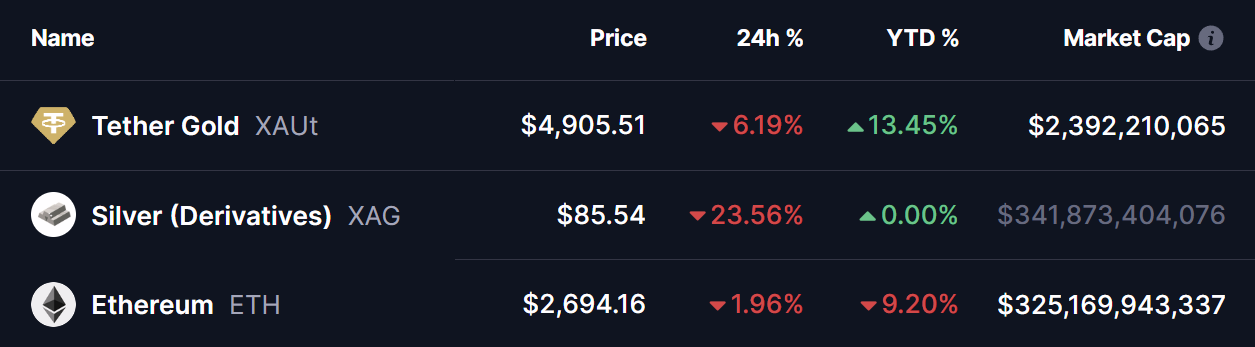
- Gold plunged more than 6%, slipping below $4,900 from its January 29 high of $5,610, sharply cutting its year-to-date gains to 13%.
- Silver saw even more damage, crashing 23% in a single day and falling below $86 from its recent high of $121.62.
While metals were bleeding, the crypto market told a different story.
Ethereum (ETH), which had been lagging earlier this year with 9.20% drip due to strength in commodities, is now showing early signs of relief when measured against gold — a shift that could hint at a broader rotation underway.
ETH/XAUT Chart Signals a Potential Shift in Momentum
On the weekly ETH/XAUT chart, price action continues to respect a large descending triangle structure that has been forming since 2021. While descending triangles are often associated with bearish continuation, they can flip bullish when macro conditions change — especially during sharp commodity dislocations like the one just witnessed.
This structure is defined by:
- A descending resistance trendline, compressing price action over multiple years.
- A well-defined horizontal zone between $0.48 and $0.5676, which has repeatedly acted as a key reaction area.
During the latest gold crash, ETH/XAUT once again pulled back into this zone, tagging the lower region near $0.5223. Instead of breaking down, price respected this area, signaling that buyers are still defending it.
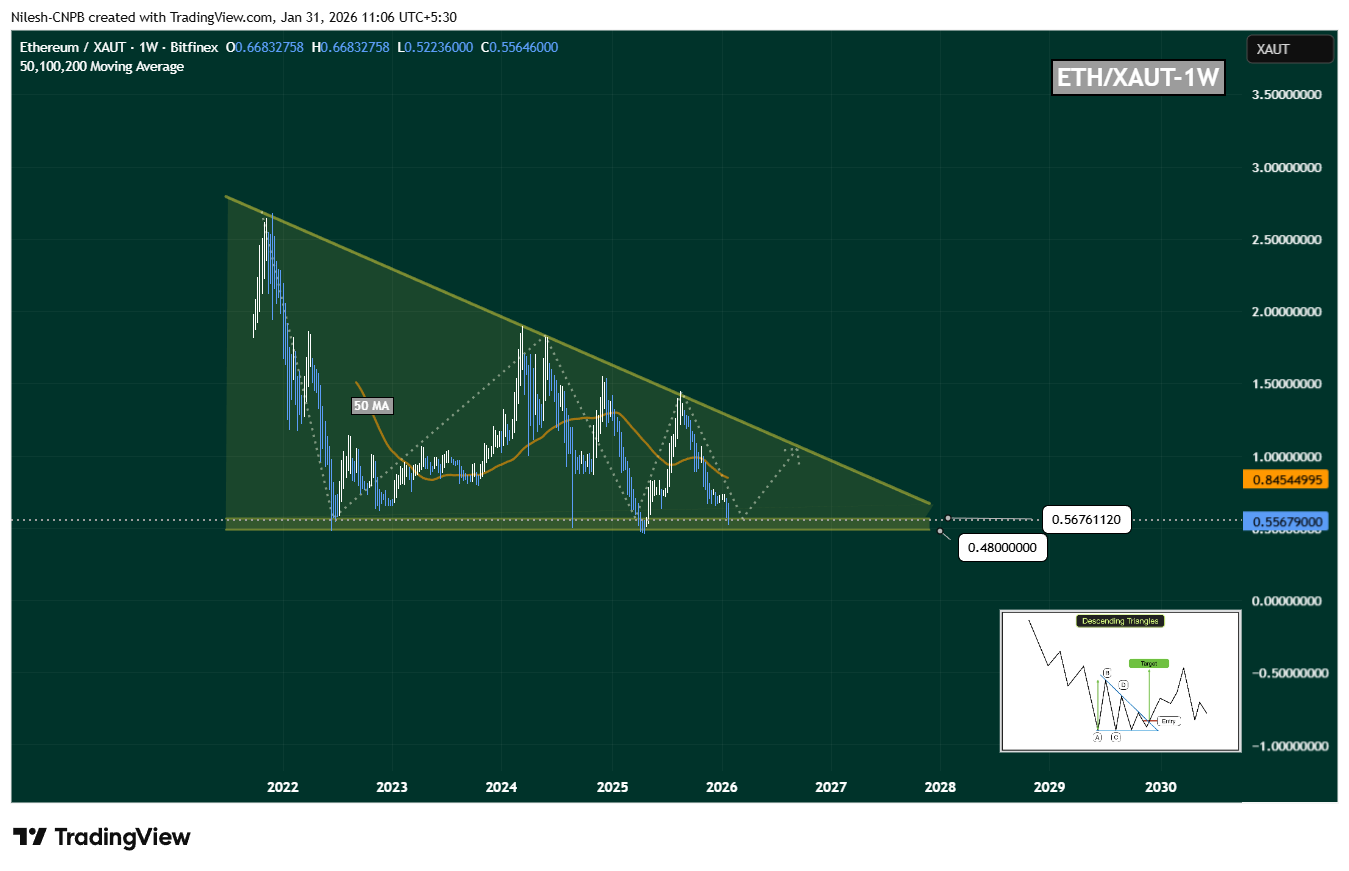
This behavior suggests the move is more likely a rotation within the larger triangle, rather than a breakdown into a new bearish leg.
50-Week Moving Average Remains the Pivot
ETH/XAUT is currently trading below the 50-week moving average, which sits near $0.8454. Historically, this level has acted as a momentum switch between prolonged underperformance and aggressive upside expansion.
A sustained reclaim of the 50-week MA would indicate that:
- Selling pressure relative to gold is easing
- Ethereum is beginning to regain strength against hard assets
- A broader trend transition may be underway
If this level flips into support, upside momentum could build quickly.
What’s Next for Ethereum (ETH)?
If bulls manage to:
- Defend the $0.48–$0.5676 zone, and
- Reclaim the 50-week moving average,
ETH/XAUT could rotate higher toward the upper descending trendline near $1.05.
A clean breakout above that level would confirm a long-term structural shift, potentially marking the start of a fresh Ethereum outperformance cycle against gold.
On the downside, a decisive weekly close below $0.48 would weaken the bullish thesis and suggest that more time — or deeper consolidation — may be required before a meaningful trend reversal can occur.
Bottom Line
Gold and silver just experienced a historic shock, and cracks are starting to show in the long-standing metals-dominance narrative. Ethereum, despite recent underperformance, is holding key relative support against gold — a subtle but important signal.
ETH hasn’t broken out yet, but it also hasn’t broken down.
If this zone continues to hold and momentum flips back above the moving averages, the current structure could mark the early stages of a long-term rotation away from gold and back into crypto.
Sometimes bottoms don’t arrive with fireworks — they arrive quietly, right when fear peaks elsewhere.
Disclaimer: The views and analysis presented in this article are for informational purposes only and reflect the author’s perspective, not financial advice. Technical patterns and indicators discussed are subject to market volatility and may or may not yield the anticipated results. Investors are advised to exercise caution, conduct independent research, and make decisions aligned with their individual risk tolerance.
About Author: Nilesh Hembade is the Founder and Lead Author of Coinsprobe, with over 5 years of experience in the cryptocurrency and blockchain industry. Since launching Coinsprobe in 2023, he has been providing daily, research-driven insights through in-depth market analysis, on-chain data, and technical research.
The opinions and market insights shared on CoinsProbe represent the views of individual authors based on prevailing market conditions at the time of publication. Cryptocurrency investments carry significant risk and volatility. Readers are encouraged to conduct their own research and seek professional financial advice before making investment decisions. CoinsProbe and its contributors do not accept responsibility for financial losses or decisions made based on published content.
CoinsProbe may publish sponsored articles, affiliate links, or promotional collaborations. All sponsored material is clearly labeled to maintain transparency with our audience. Our editorial decisions remain fully independent, and advertising partnerships do not influence reviews, rankings, or published opinions.
Since 2023, CoinsProbe has delivered reliable insights on cryptocurrency, blockchain, and digital assets. Our content is created by experienced researchers and analysts who follow strict editorial standards focused on accuracy, transparency, and credibility. Every article is carefully reviewed and verified using trusted sources and current market data. We provide unbiased analysis and timely updates covering everything from emerging crypto projects to major industry developments.