
Date: Sun, Dec 21 2025 | 05:34 AM GMT
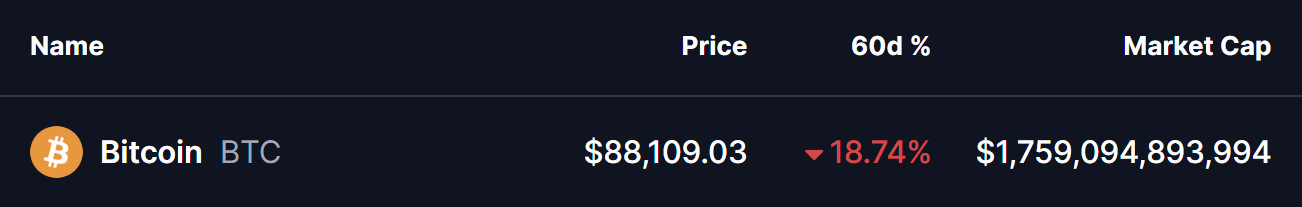
The broader cryptocurrency market has experienced choppy and directionless price action over the past several weeks, a phase that began following the sharp sell-off on October 10. That correction pushed Bitcoin (BTC) down from sub-$120,000 levels to the current $88,000 area, leaving traders cautious and risk appetite subdued. Over the last 60 days alone, BTC has declined by nearly 18%, reinforcing a short-term bearish narrative across the market.
Despite the ongoing weakness, the higher-timeframe technical picture is beginning to suggest something more constructive. Price behavior on the daily chart now resembles a familiar structure from earlier this year, raising the possibility that downside momentum may be fading and that Bitcoin could be approaching a potential trend reversal rather than an extended continuation lower.
Fractal Setup Hints at a Bullish Reversal
On the 3 day timeframe chart shared by crypto analyst CRG, Bitcoin’s current price action closely mirrors a pattern that played out during March and April 2025. At that time, Bitcoin topped near the $108,000 level before entering a sharp corrective phase that dragged price down into the $74,000–$76,000 range. While the decline appeared aggressive, momentum indicators told a different story beneath the surface.
As price pushed to marginally lower lows, the Relative Strength Index (RSI) failed to confirm the weakness. Instead, it formed a clear higher low, signaling a bullish divergence. This divergence marked a loss of downside momentum and ultimately preceded a strong recovery that carried Bitcoin back above $108,000, followed by a continuation toward fresh highs.
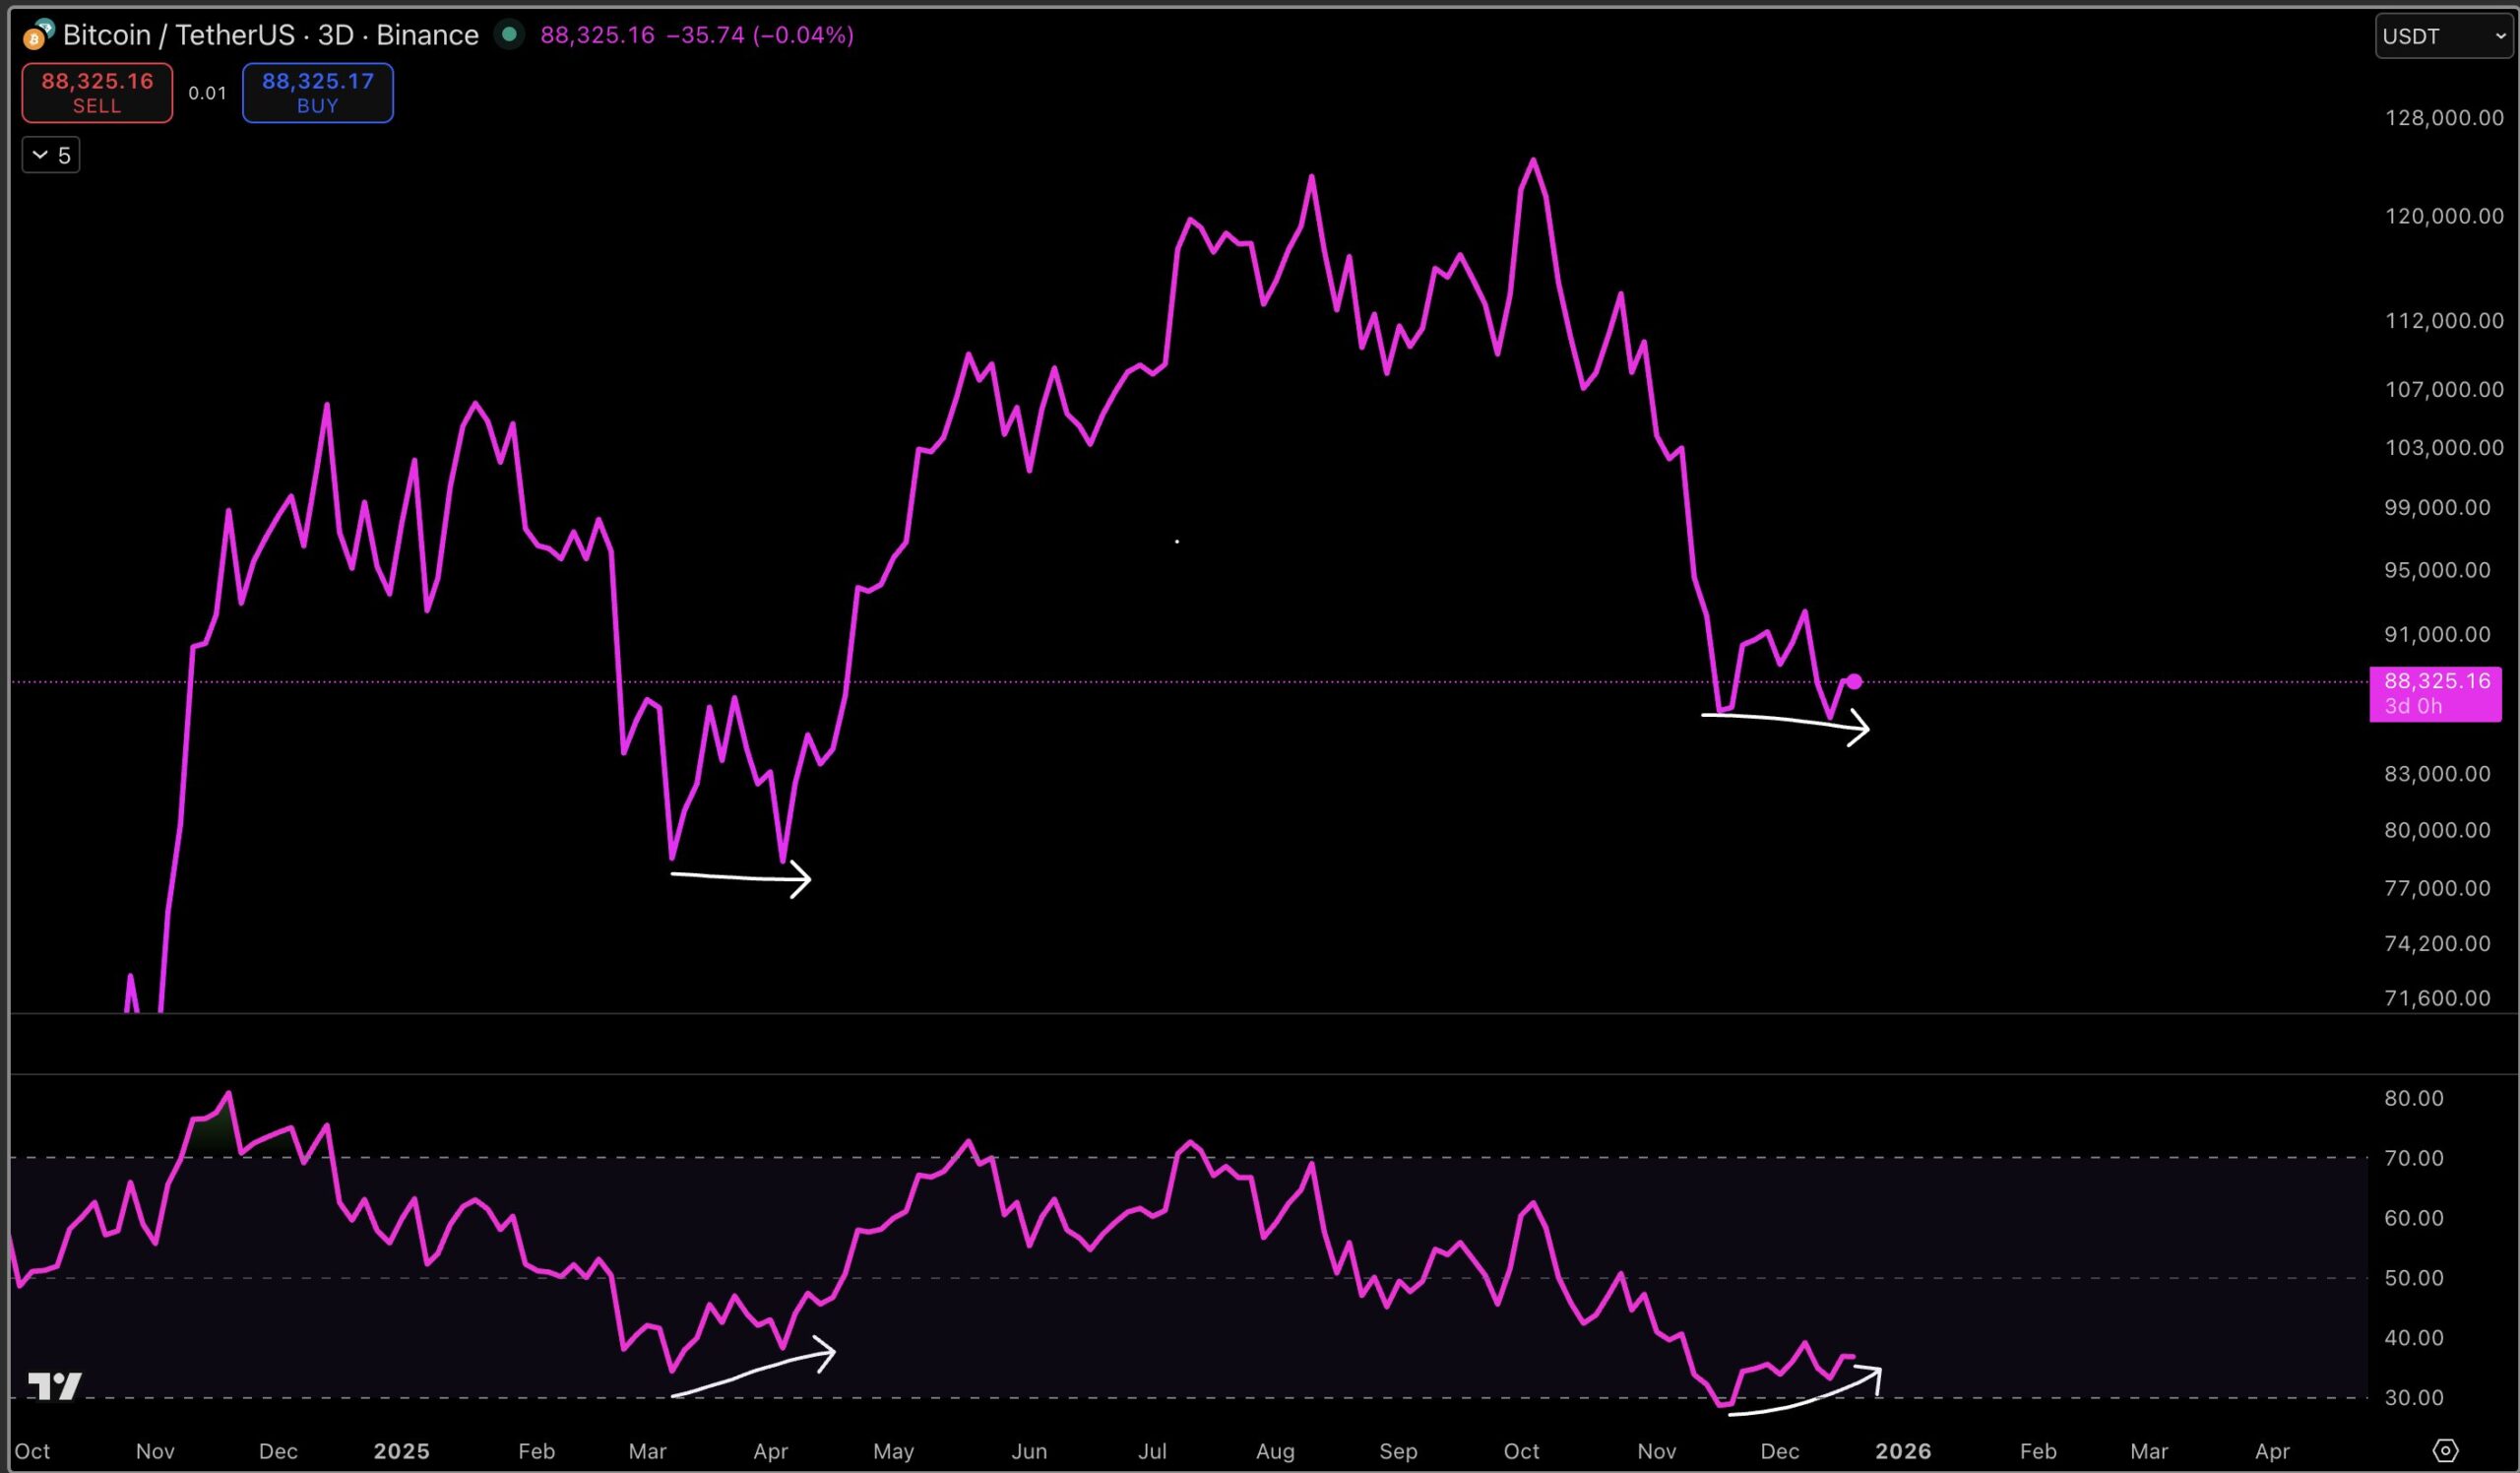
Fast forward to the present structure, and the similarities are striking.
After peaking in the $120,000–$125,000 zone, Bitcoin once again experienced a sharp sell-off, this time finding support just below $81,000. Since then, price has stabilized and begun consolidating around $88,000, struggling to reclaim higher resistance levels but, importantly, failing to extend meaningfully lower. This lack of downside follow-through mirrors the earlier fractal almost point for point.
Momentum is once again reinforcing the comparison. While price briefly dipped to comparable or slightly lower levels, the RSI did not follow. Instead, it printed a higher low, signaling that bearish pressure is weakening despite continued price compression. This exact momentum behavior was present during the previous corrective phase, just before Bitcoin transitioned into its next impulsive move higher.
What’s Next for BTC?
If the current fractal continues to unfold in a similar manner, the $81,000–$90,000 range may ultimately be viewed not as a breakdown zone, but as a final consolidation area before Bitcoin attempts another move toward six-figure prices. A sustained reclaim of the $95,000–$100,000 region would serve as the first meaningful confirmation that the market is following the prior script.
That said, fractals are not predictive guarantees. They do not offer precise price targets or timelines. Instead, they provide context by highlighting repeating market behavior. When similar structures emerge under similar conditions—especially when confirmed by momentum divergence—the probability of a comparable outcome increases. In the previous instance, that outcome was continuation higher after a period of sideways consolidation.
For now, the message from the chart remains clear. Downside pressure appears to be weakening, momentum is stabilizing, and Bitcoin is behaving in much the same way it did before its last major expansion. While the market may feel quiet and uncertain, history shows that these periods of compression often precede significant directional moves.
Disclaimer: The views and analysis presented in this article are for informational purposes only and reflect the author’s perspective, not financial advice. Technical patterns and indicators discussed are subject to market volatility and may or may not yield the anticipated results. Investors are advised to exercise caution, conduct independent research, and make decisions aligned with their individual risk tolerance.
The opinions and market insights shared on CoinsProbe represent the views of individual authors based on prevailing market conditions at the time of publication. Cryptocurrency investments carry significant risk and volatility. Readers are encouraged to conduct their own research and seek professional financial advice before making investment decisions. CoinsProbe and its contributors do not accept responsibility for financial losses or decisions made based on published content.
CoinsProbe may publish sponsored articles, affiliate links, or promotional collaborations. All sponsored material is clearly labeled to maintain transparency with our audience. Our editorial decisions remain fully independent, and advertising partnerships do not influence reviews, rankings, or published opinions.
Since 2023, CoinsProbe has delivered reliable insights on cryptocurrency, blockchain, and digital assets. Our content is created by experienced researchers and analysts who follow strict editorial standards focused on accuracy, transparency, and credibility. Every article is carefully reviewed and verified using trusted sources and current market data. We provide unbiased analysis and timely updates covering everything from emerging crypto projects to major industry developments.