
Date: Thu, Aug 14, 2025 | 07:10 AM GMT
The cryptocurrency market is in full bullish swing as Bitcoin (BTC) hits a new all-time high of $124,000 today, while Ethereum (ETH) broke above the $4,700 mark for the first time since 2021, surging over 29% in weekly gains. This surge has boosted sentiment across major altcoins, including Worldcoin (WLD).
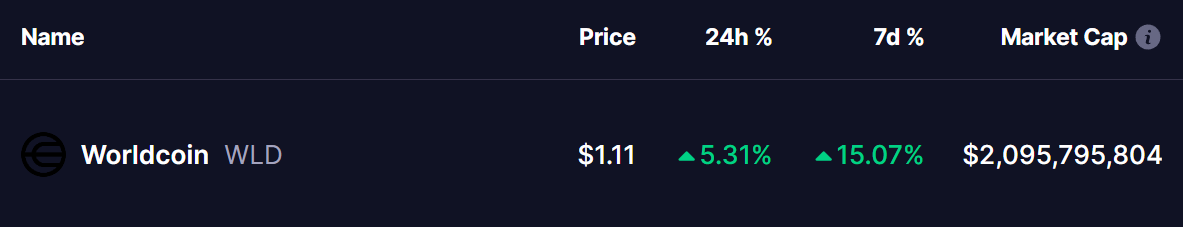
WLD has posted an impressive 15% gain this week, and more importantly, its latest chart reveals a key harmonic pattern that suggests further upside potential in the short term.
Harmonic Pattern Hints at Bullish Continuation
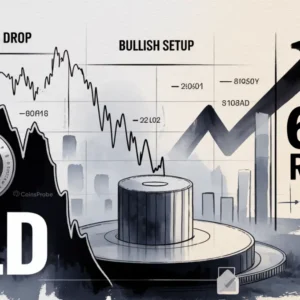
On the daily chart, WLD is forming a Bearish Butterfly harmonic pattern. Despite its name, this pattern often precedes strong rallies during the CD leg — typically the most aggressive phase of the move.
The setup began at point X near $1.63, dropped to point A, rebounded to point B, and then slid again to point C around $0.9010. From that low, WLD has staged a sharp rebound, now trading near $1.10 and showing signs of renewed buying momentum.
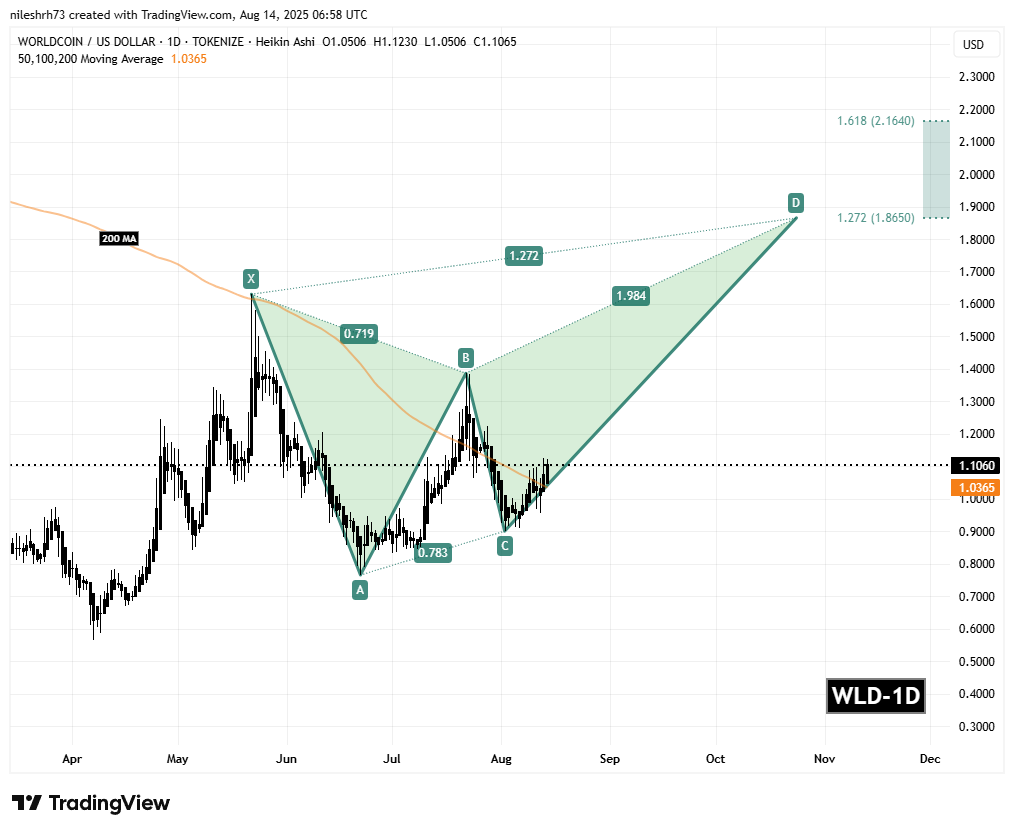
If the CD leg plays out as projected, the Potential Reversal Zone (PRZ) sits between $1.8650 (1.272 Fibonacci extension) and $2.1640 (1.618 extension). These are historically significant levels where the Butterfly pattern tends to complete, often triggering consolidation or profit-taking after the rally.
What’s Next for WLD?
If bullish momentum and trading volume continue to climb, WLD could be on track for a move of up to 95% toward the $2.1640 target, where point D is projected. That area, however, is also expected to act as a major resistance and could be a turning point for the trend.
Maintaining price action above the 200-day moving average, currently near $1.03, will be crucial for keeping this bullish outlook intact. A breakdown below that level could weaken the pattern and invite a short-term correction.

Disclaimer: This article is for informational purposes only and not financial advice. Always conduct your own research before investing in cryptocurrencies.
The opinions and market insights shared on CoinsProbe represent the views of individual authors based on prevailing market conditions at the time of publication. Cryptocurrency investments carry significant risk and volatility. Readers are encouraged to conduct their own research and seek professional financial advice before making investment decisions. CoinsProbe and its contributors do not accept responsibility for financial losses or decisions made based on published content.
CoinsProbe may publish sponsored articles, affiliate links, or promotional collaborations. All sponsored material is clearly labeled to maintain transparency with our audience. Our editorial decisions remain fully independent, and advertising partnerships do not influence reviews, rankings, or published opinions.
Since 2023, CoinsProbe has delivered reliable insights on cryptocurrency, blockchain, and digital assets. Our content is created by experienced researchers and analysts who follow strict editorial standards focused on accuracy, transparency, and credibility. Every article is carefully reviewed and verified using trusted sources and current market data. We provide unbiased analysis and timely updates covering everything from emerging crypto projects to major industry developments.