
Date: Sat, Jan 18, 2025, 05:49 AM GMT
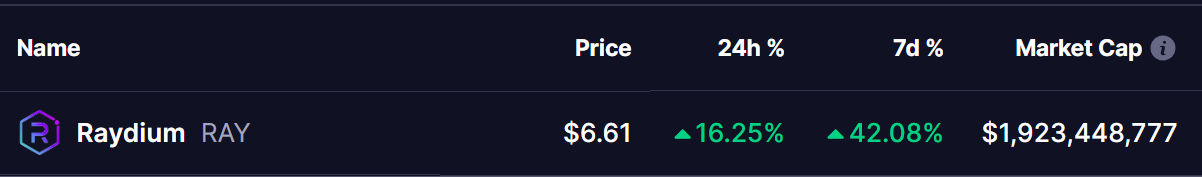
This week, the cryptocurrency market has been brimming with bullish momentum. Bitcoin (BTC) surged from its Monday low of $89,000 to its current level above $103,000. Alongside this recovery, Raydium (RAY)—the leading decentralized exchange (DEX) on Solana—has captured attention with a major milestone in on-chain metrics and a noticeable price surge of over 16%.
This pushed RAY into a key resistance zone, hinting at a potential upside move.
TVL Hits a New All-Time High
According to data from Defillama, Raydium’s Total Value Locked (TVL) reached a new all-time high of $2.589 billion today. Over the past year, the DEX has demonstrated remarkable growth, with its TVL skyrocketing from just $128 million in early 2024 to the current record level.
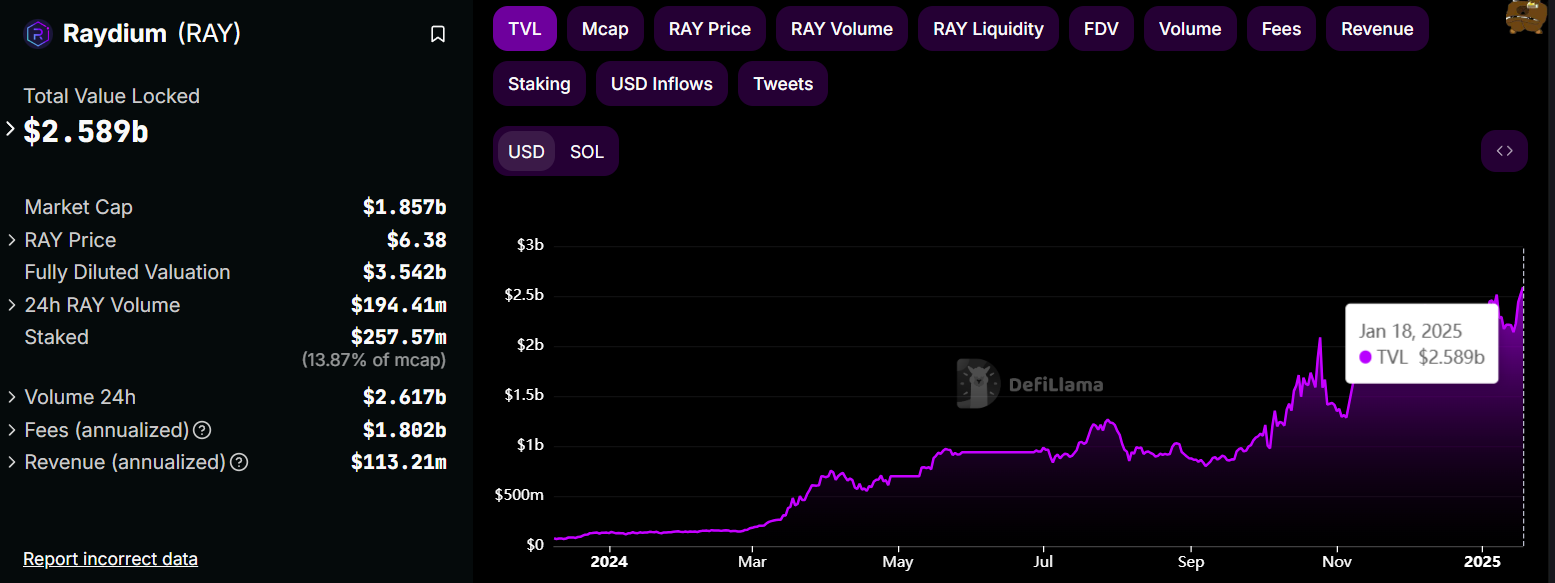
This exponential growth can largely be attributed to the expansion of the Solana ecosystem, which has attracted both developers and liquidity providers to projects like Raydium.
Could This Breakout Spark Further Rally?
Raydium’s price action has been equally noteworthy, with weekly gains of 42%. The recent rally was triggered by a critical breakout above the $5.07 level, signaling the conclusion of a falling wedge pattern that had kept the price suppressed for weeks.
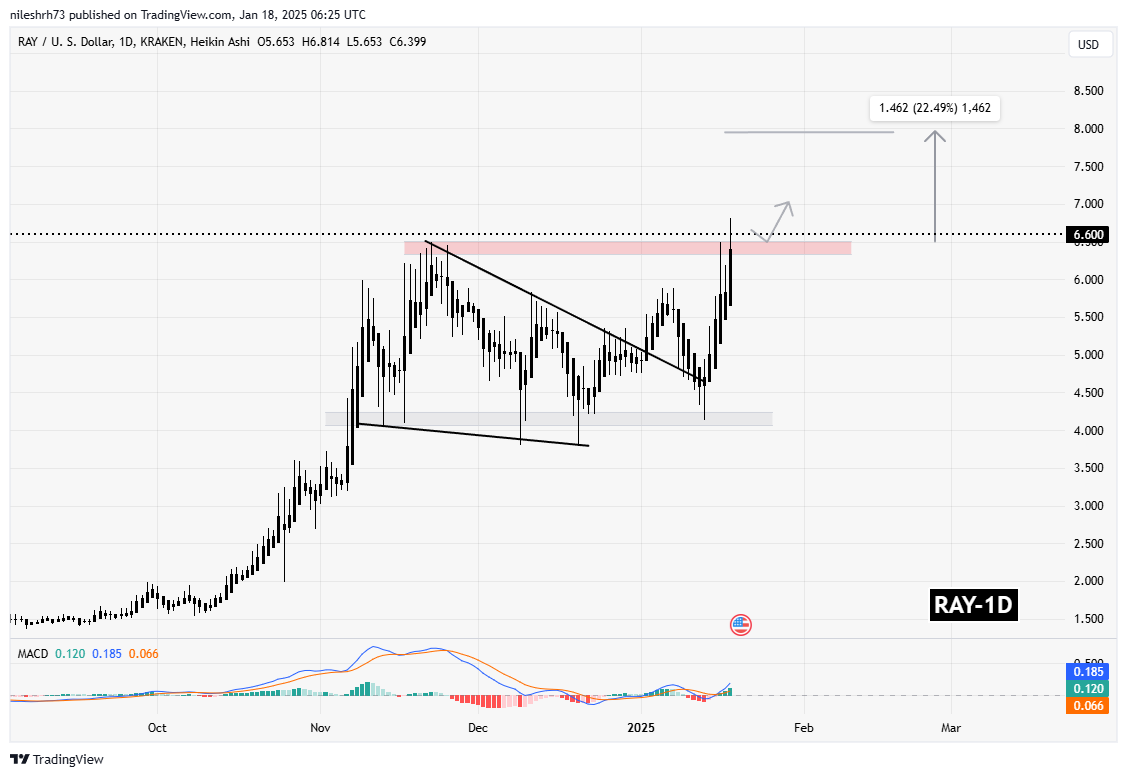
Following a successful retest, RAY’s momentum accelerated. Today’s surge allowed RAY to break out of the horizontal resistance zone at $6.50, with the token currently trading at $6.61. From this level, RAY could potentially retest the $6.50 support zone before advancing toward the next resistance level at $7.95, representing a 22% potential gain from the current resistance zone.
If RAY successfully crosses the $7.95 mark, it could pave the way for a larger bullish rally in the coming weeks.
Technical Indicators Signal Strength
The MACD (Moving Average Convergence Divergence) indicator is showing strong bullish momentum. The histogram has flipped positive, and the MACD line is well above the signal line, suggesting that buying pressure is likely to continue.
Additionally, trading volumes have surged significantly, reinforcing the breakout and indicating strong interest from buyers at the current levels.
Market Environment
The overall recovery in the cryptocurrency market, driven by Bitcoin’s bounce and speculation surrounding President-elect Donald Trump’s potential policy moves, has created a favorable environment for altcoins like RAY. The combination of strong on-chain metrics, bullish technical indicators, and macro market trends could propel RAY further in the coming weeks.

Disclaimer: This article is for informational purposes only and does not constitute financial advice. Always conduct your own research before investing in cryptocurrencies.
The opinions and market insights shared on CoinsProbe represent the views of individual authors based on prevailing market conditions at the time of publication. Cryptocurrency investments carry significant risk and volatility. Readers are encouraged to conduct their own research and seek professional financial advice before making investment decisions. CoinsProbe and its contributors do not accept responsibility for financial losses or decisions made based on published content.
CoinsProbe may publish sponsored articles, affiliate links, or promotional collaborations. All sponsored material is clearly labeled to maintain transparency with our audience. Our editorial decisions remain fully independent, and advertising partnerships do not influence reviews, rankings, or published opinions.
Since 2023, CoinsProbe has delivered reliable insights on cryptocurrency, blockchain, and digital assets. Our content is created by experienced researchers and analysts who follow strict editorial standards focused on accuracy, transparency, and credibility. Every article is carefully reviewed and verified using trusted sources and current market data. We provide unbiased analysis and timely updates covering everything from emerging crypto projects to major industry developments.