
Date: Wed, Jan 15, 2025, 07:16 AM GMT
In the cryptocurrency market, we are witnessing a strong rebound after facing a sharp correction on Monday where the price of Bitcoin (BTC) plunged to a low of $89,216 and has now recovered to above the $97K level.
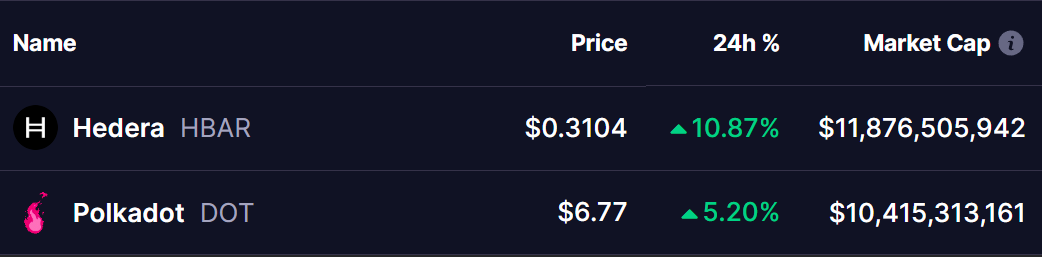
This bullish momentum is spilling over into major altcoins, with Hedera (HBAR) and Polkadot (DOT) also building strength today. Both tokens have risen by 10% and 5%, respectively, and are approaching critical breakout levels, signaling a potential continuation of the rally.
Hedera (HBAR)
Hedera (HBAR) is currently trading at $0.31 and is moving closer to the upper resistance of a bullish pennant. The token has been consolidating within this pattern for several weeks, but the latest bullish momentum suggests that a breakout might be imminent.
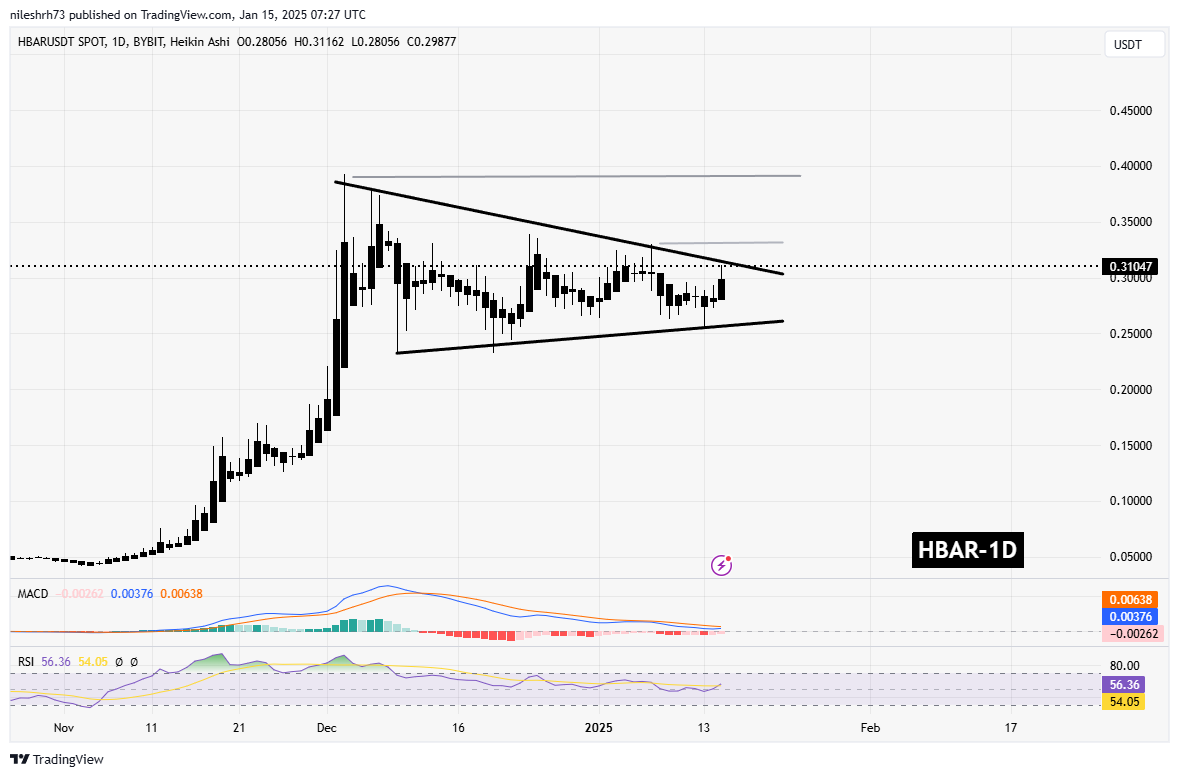
If HBAR manages to break above the upper resistance of the pennant with a possible retest, it could trigger a rally toward its next resistance levels at $0.33 and $0.39. This represents a potential gain of up to 25% from the current price.
Indicators:
- MACD: The Moving Average Convergence Divergence (MACD) indicator is showing signs of a bullish crossover, suggesting increasing momentum in favor of buyers.
- RSI: The Relative Strength Index (RSI) is currently at 56.36, indicating moderate bullish momentum without entering the overbought zone.
A strong breakout above the pennant, accompanied by increased volume, could solidify HBAR’s next upward leg.

Polkadot (DOT)
Polkadot (DOT), currently trading at $6.77, is showing signs of a potential breakout as it approaches the upper resistance line of a descending triangle pattern, along with its horizontal resistance zone. After several weeks of consolidation within this structure, the recent surge suggests that bullish momentum may push DOT above this critical resistance level.
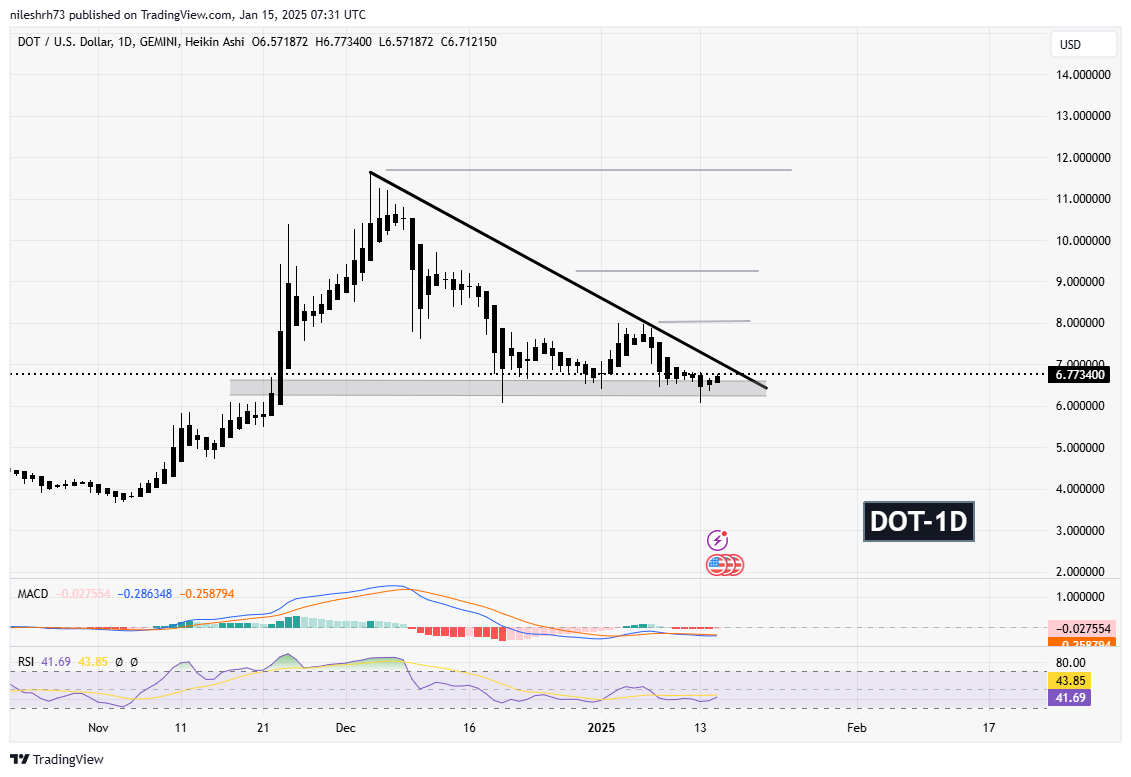
If DOT manages to break above the upper resistance of the triangle, it could trigger a rally toward its next resistance levels at $8, $9.26, and $11.63. This represents a potential gain of up to 72% from the current price.
Indicators:
- MACD: The MACD for DOT is approaching a bullish crossover, hinting at a shift in momentum toward the bulls.
- RSI: The RSI for DOT stands at 41.69, indicating room for further upside as it remains below the overbought region.
Is A Rally On The Horizon?
The broader cryptocurrency market’s recovery, led by Bitcoin’s strong rebound, has set the stage for altcoins like HBAR and DOT to break out of their respective patterns. The pattern formations on both charts suggest that a breakout above resistance could ignite significant rallies for these tokens.
However, it is crucial for both HBAR and DOT to sustain their bullish momentum and successfully break out with strong volume confirmation. A failure to do so could lead to continued consolidation or even downside risk.

Disclaimer: This article is for informational purposes only and not financial advice. Always conduct your own research before investing in cryptocurrencies.
The opinions and market insights shared on CoinsProbe represent the views of individual authors based on prevailing market conditions at the time of publication. Cryptocurrency investments carry significant risk and volatility. Readers are encouraged to conduct their own research and seek professional financial advice before making investment decisions. CoinsProbe and its contributors do not accept responsibility for financial losses or decisions made based on published content.
CoinsProbe may publish sponsored articles, affiliate links, or promotional collaborations. All sponsored material is clearly labeled to maintain transparency with our audience. Our editorial decisions remain fully independent, and advertising partnerships do not influence reviews, rankings, or published opinions.
Since 2023, CoinsProbe has delivered reliable insights on cryptocurrency, blockchain, and digital assets. Our content is created by experienced researchers and analysts who follow strict editorial standards focused on accuracy, transparency, and credibility. Every article is carefully reviewed and verified using trusted sources and current market data. We provide unbiased analysis and timely updates covering everything from emerging crypto projects to major industry developments.