
Date: Thu, Jan 09, 2025, 04:07 AM GMT
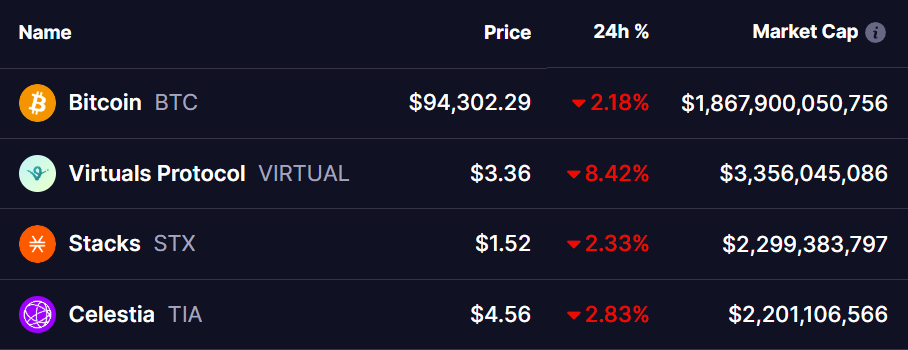
The cryptocurrency market has experienced turbulence in the past 72 hours, with Bitcoin (BTC) taking a significant hit, dropping from $102K to $94K. This sharp decline has triggered substantial liquidations across the market, leading to a domino effect on altcoins.
Among the impacted tokens, Virtuals Protocol (VIRTUAL), Stacks (STX), and Celestia (TIA) have all approached critical support levels, signaling potential turning points.
Virtuals Protocol (VIRTUAL)
VIRTUAL is currently consolidating within a descending triangle pattern, reflecting a persistent downtrend since its all-time high (ATH) of $5.14 on Jan 2. The recent dip saw VIRTUAL plummet from $4.43 to $3.36, bringing it into a key support zone between $3.18 and $3.42. This zone, previously a resistance level, has now flipped into a robust support.
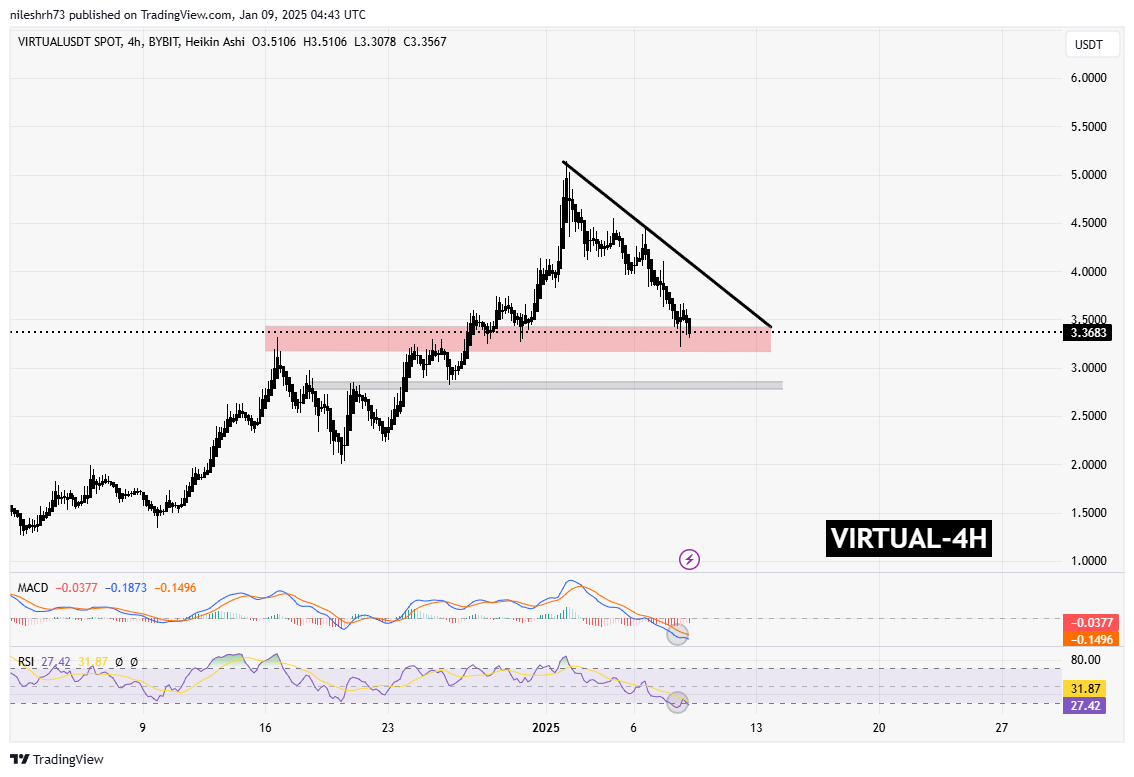
- Technical Indicators:
- The MACD shows a bearish crossover, but histogram bars are shortening, suggesting declining selling pressure.
- The RSI has dropped near the oversold region, indicating a potential reversal is on the horizon.
If VIRTUAL holds the lower boundary of the descending triangle and bounces, it could spark a short-term rally toward the triangle’s upper resistance. However, a breakdown below this zone may lead to a deeper correction to $2.84.
Stacks (STX)
Stacks (STX) is consolidating within a falling wedge pattern, a bullish structure despite the overall downtrend that started after its peak of $3.02 on Dec 6. The recent drop pushed STX from $1.85 to its current price of $1.52, positioning it within the crucial support zone between $1.44 and $1.56. Historically, this zone has been a key reversal level.
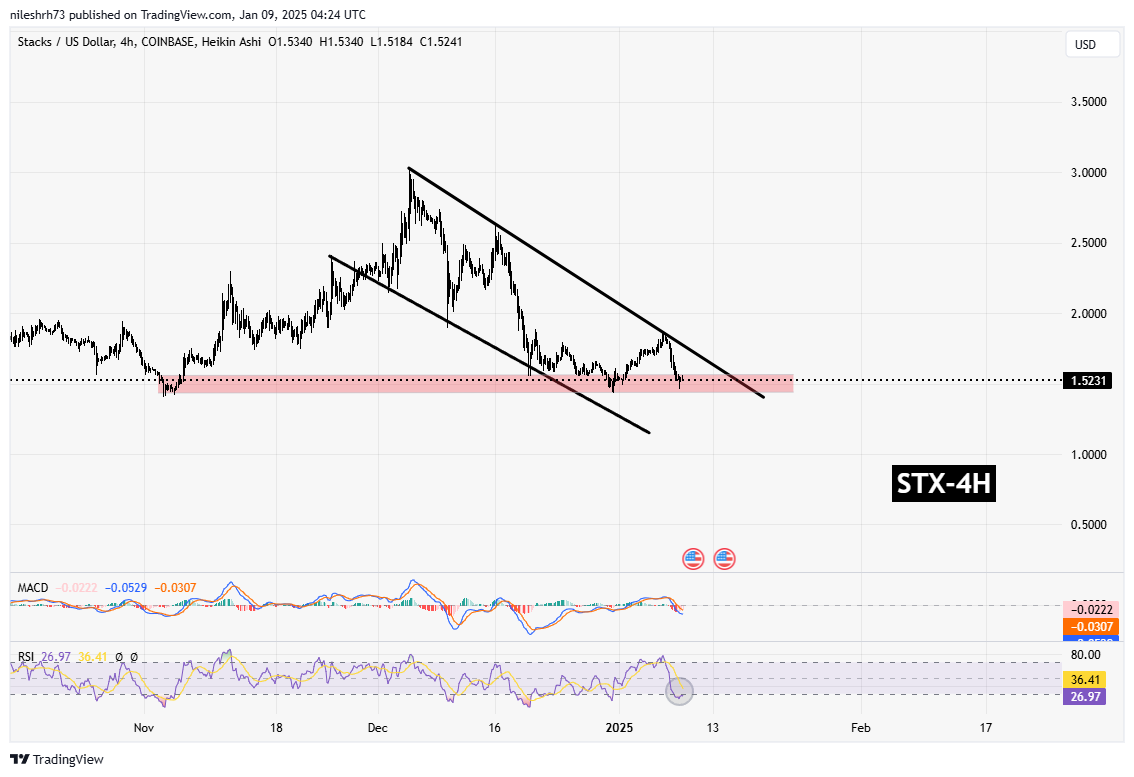
- Technical Indicators:
- The MACD shows signs of flattening, with potential for a bullish crossover if momentum shifts.
- The RSI hovers just above the oversold area, signaling the likelihood of a rebound.
A successful defense of this support zone could push STX toward the wedge resistance level, paving the way for a potential breakout.

Celestia (TIA)
Celestia (TIA) saw its price tumble from $5.68 to $4.56, bringing it into a critical support zone between $4.25 and $4.74. This zone has historically served as a reliable floor for price reversals.
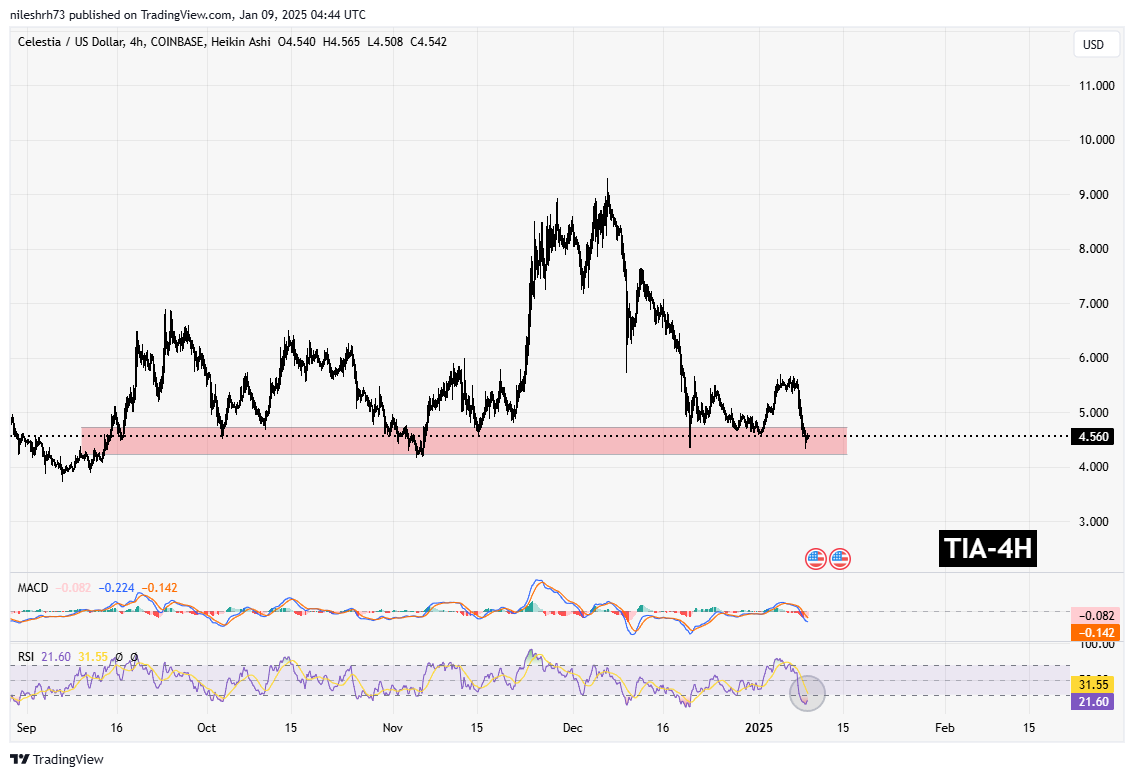
- Technical Indicators:
- The MACD indicates bearish momentum is waning, suggesting a possible bullish turnaround.
- The RSI is nearing oversold conditions, reinforcing the potential for a recovery.
If TIA holds this support, it could stage a reversal toward its previous resistance at $5.68. A failure to hold, however, might result in a retest of the $4.00 level.
What’s Ahead?
As these three altcoins hover around key support levels, their immediate future largely depends on Bitcoin’s performance. BTC is trading at a critical support level of $94K, with both the MACD and RSI indicating that a bounce may be imminent.

Should BTC recover from this support, it could lead to a broader market rally, lifting altcoins like VIRTUAL, STX, and TIA in the process.
However, if BTC fails to hold its support, these altcoins may face further downward pressure. Traders are advised to monitor BTC’s movements closely, as well as volume and momentum indicators for these altcoins.

Disclaimer: This article is for informational purposes only and does not constitute financial advice. Always conduct your own research before making investment decisions.
The opinions and market insights shared on CoinsProbe represent the views of individual authors based on prevailing market conditions at the time of publication. Cryptocurrency investments carry significant risk and volatility. Readers are encouraged to conduct their own research and seek professional financial advice before making investment decisions. CoinsProbe and its contributors do not accept responsibility for financial losses or decisions made based on published content.
CoinsProbe may publish sponsored articles, affiliate links, or promotional collaborations. All sponsored material is clearly labeled to maintain transparency with our audience. Our editorial decisions remain fully independent, and advertising partnerships do not influence reviews, rankings, or published opinions.
Since 2023, CoinsProbe has delivered reliable insights on cryptocurrency, blockchain, and digital assets. Our content is created by experienced researchers and analysts who follow strict editorial standards focused on accuracy, transparency, and credibility. Every article is carefully reviewed and verified using trusted sources and current market data. We provide unbiased analysis and timely updates covering everything from emerging crypto projects to major industry developments.