Date: Thu, Nov 14, 2024, 02:29 PM GMT
The cryptocurrency market has recently experienced a resurgence of bullish momentum, primarily led by Bitcoin (BTC), which has surged by over 22% in just the past week following the unexpected U.S. election victory of Donald Trump on Nov. 05.
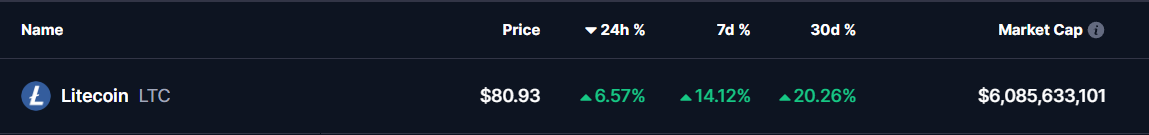
This wave of bullishness has sparked impressive rallies across major cryptocurrencies, with top tokens like Cardano (ADA) and Dogecoin (DOGE) seeing substantial gains. Joining this momentum is Litecoin (LTC), which has risen over 6% and is currently trading above the $80 mark.
Three-Year Breakout Signals a New Bullish Phase for Litecoin
After trading in a prolonged consolidation phase, Litecoin (LTC) has finally broken out of a significant three-year downward trend, as highlighted in the technical charts. This breakout is notable as it suggests that Litecoin may be entering a new bullish phase, supported by both technical indicators and broader market sentiment.
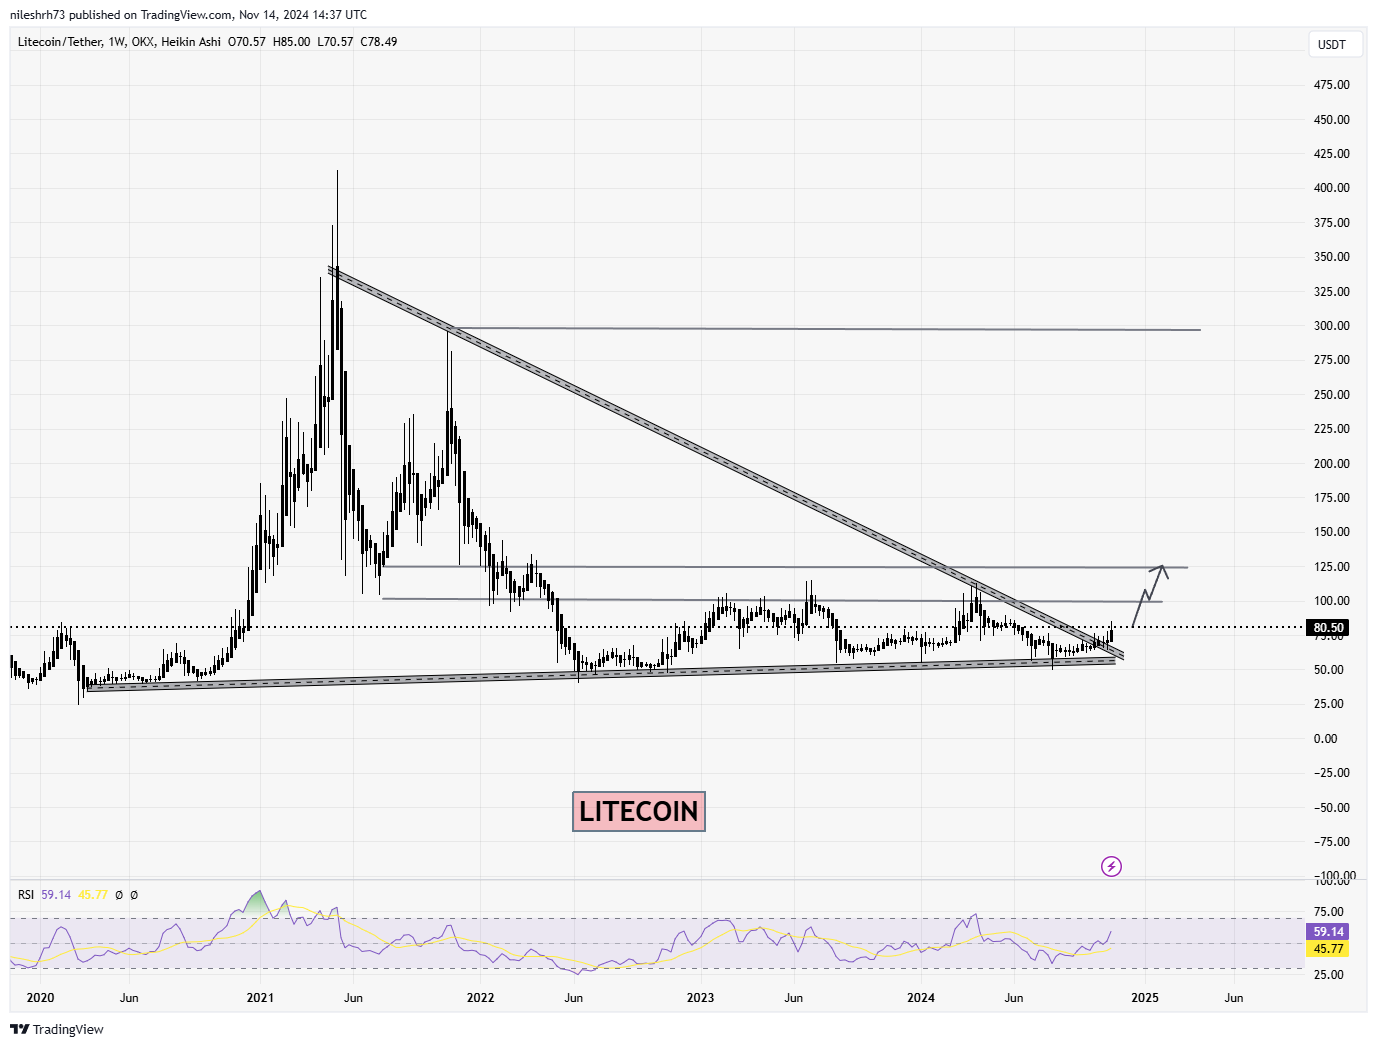
The above chart (Weekly LTC/USDT) shows Litecoin’s breakout from a long-term descending trendline, a structure that had previously limited upward movement for nearly three years. This breakout could signify a shift in LTC’s market structure, hinting at a potential long-term rally. The dotted horizontal lines on the chart suggest key resistance levels, with the $100 psychological mark and the $125 level as immediate resistance zones. Should Litecoin maintain this upward trajectory, breaking past these levels could open the path toward $150 or even higher in the medium term.
In addition to the breakout, the Relative Strength Index (RSI) in the weekly timeframe is trending above 59, indicating a favorable momentum and suggesting that Litecoin is not yet overbought. This metric supports the idea of sustained buying interest, as the RSI typically reflects the strength and duration of a trend.

Is the Rally Sustainable? Insights from Monthly Chart Analysis
The second chart (Monthly LTC/USD) provides a broader perspective, highlighting Litecoin’s historical price movements with significant halving events for both Bitcoin and Litecoin. Historically, LTC has seen price surges in the months following Bitcoin and Litecoin halvings, and the current setup appears consistent with these prior post-halving rallies.
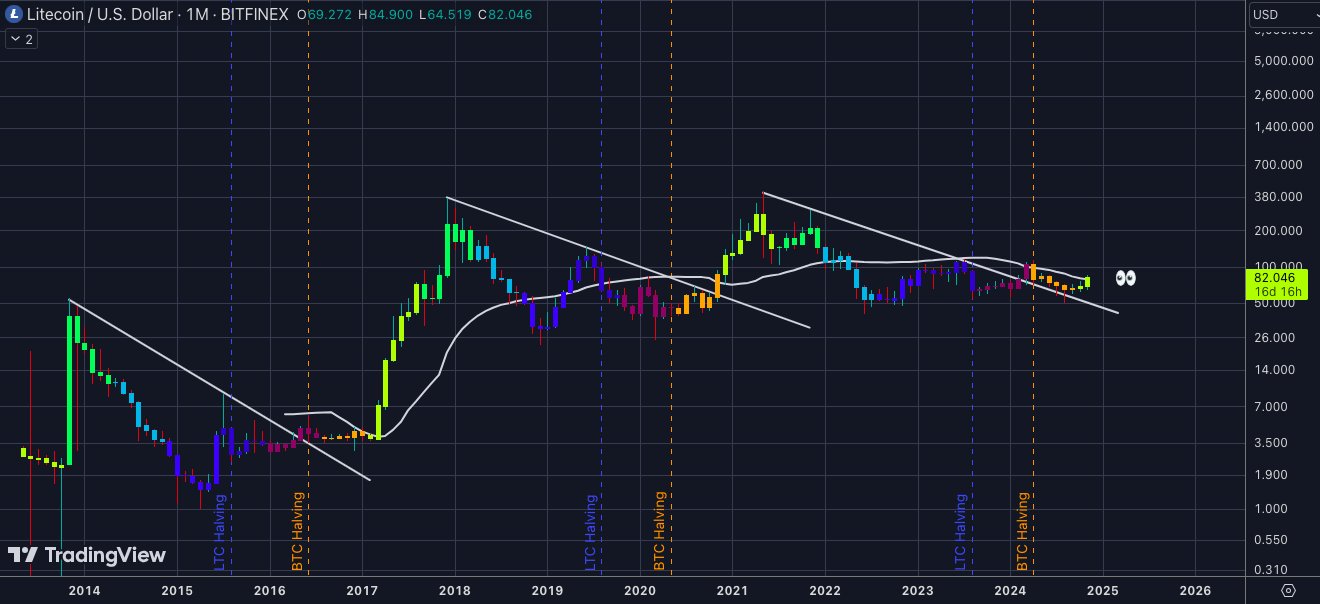
The chart also shows that LTC recently broke out of a multi-year descending channel and is hovering around the $82 mark, potentially testing the $100 resistance level in the coming weeks.
A glance at the Moving Average in the monthly chart reveals that Litecoin has managed to stabilize above this level, which could serve as a support for further gains. The breakout from this descending channel could attract both short-term traders and long-term investors, as historical data suggests similar breakouts in Litecoin’s price often lead to prolonged rallies.
What to Expect Ahead?
While Litecoin’s technical setup is promising, it’s essential to keep an eye on broader market trends, especially with Bitcoin as a leading indicator. Given the strong correlation between BTC and LTC, any significant movements in Bitcoin’s price could impact Litecoin’s trajectory.
In the near term, the technical indicators suggest that Litecoin could aim for the $100–$125 range, with a more bullish scenario potentially targeting levels around $150. However, a pullback to retest the breakout level around $70–$80 is also possible as traders lock in profits.
Disclaimer: This article is for informational purposes only and not financial advice. Always conduct your own research before investing in cryptocurrencies.
This draft combines the recent market context with technical insights from the charts provided. Let me know if you’d like further adjustments!
The opinions and market insights shared on CoinsProbe represent the views of individual authors based on prevailing market conditions at the time of publication. Cryptocurrency investments carry significant risk and volatility. Readers are encouraged to conduct their own research and seek professional financial advice before making investment decisions. CoinsProbe and its contributors do not accept responsibility for financial losses or decisions made based on published content.
CoinsProbe may publish sponsored articles, affiliate links, or promotional collaborations. All sponsored material is clearly labeled to maintain transparency with our audience. Our editorial decisions remain fully independent, and advertising partnerships do not influence reviews, rankings, or published opinions.
Since 2023, CoinsProbe has delivered reliable insights on cryptocurrency, blockchain, and digital assets. Our content is created by experienced researchers and analysts who follow strict editorial standards focused on accuracy, transparency, and credibility. Every article is carefully reviewed and verified using trusted sources and current market data. We provide unbiased analysis and timely updates covering everything from emerging crypto projects to major industry developments.