
Key Takeaways
- ZEC confirmed a descending triangle breakdown after losing the $334–$312 neckline zone.
- Last week’s bounce toward $324 now appears to be a classic breakdown retest, followed by fresh rejection.
- If weakness continues, $203.55 is the next major support to watch, with a deeper downside target near $76.
The broader crypto market is starting to cool off after last week’s relief rally, with both Bitcoin and Ethereum trading in the red today, posting roughly 2% and 4% losses over the past 24 hours.
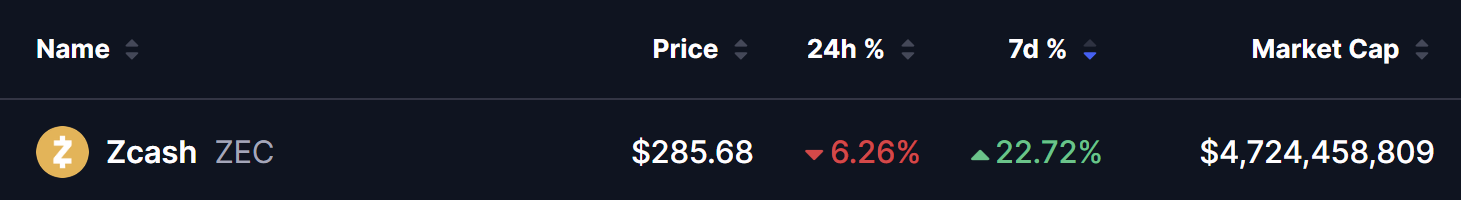
Altcoins are feeling that pressure — and privacy-focused token Zcash (ZEC) is no exception.
ZEC is down around 6% on the day, trimming its weekly gains to about 22%. More importantly, its chart structure is flashing warning signs that suggest the recent bounce may have been nothing more than a technical retest — with further downside still on the table.
Descending Triangle Breakdown and Retest
On the daily chart, ZEC has been in a clear downtrend since topping near the $700 area back in November 2025.
Price action carved out a descending triangle, a classic bearish continuation pattern defined by lower highs pressing against a flat support base. Last month, ZEC finally broke below the critical neckline zone between $334–$312, confirming the breakdown.
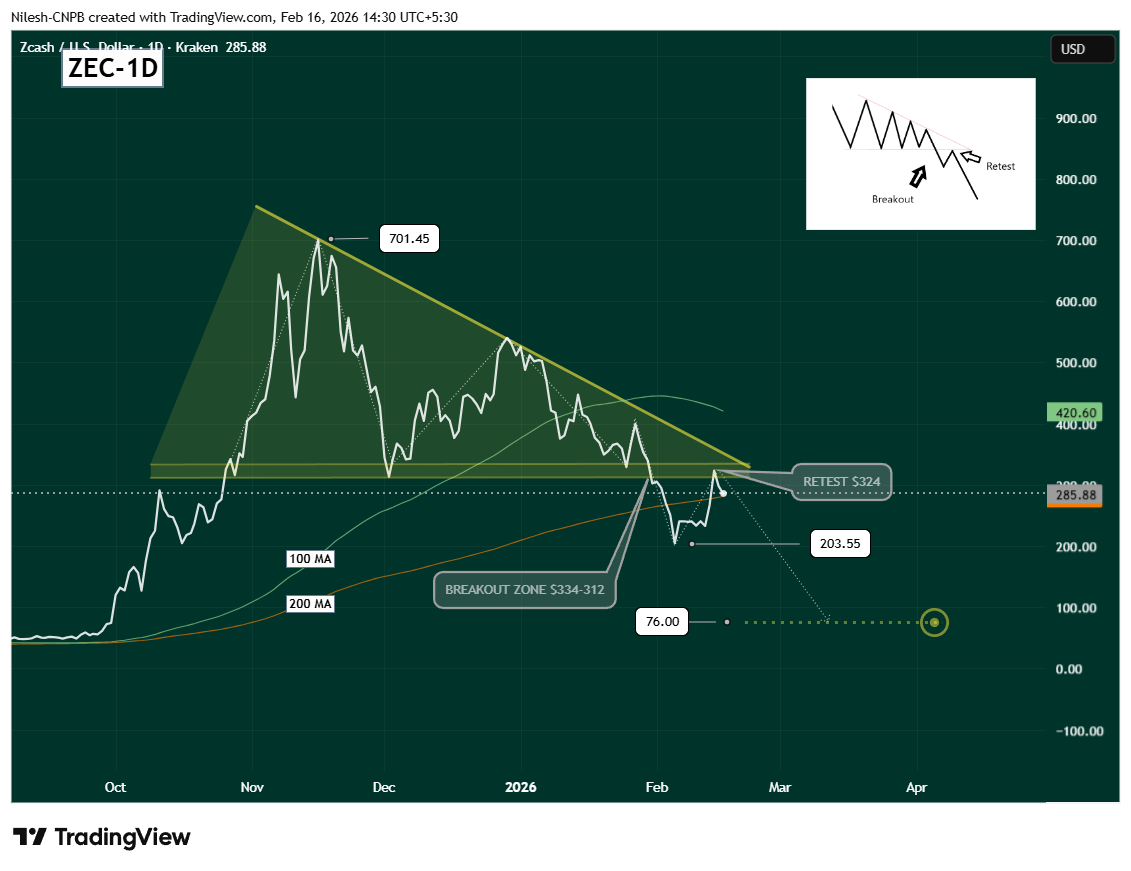
After sliding to a local low around $203.55, ZEC staged a sharp rebound last week, briefly pushing back toward $324. However, this move now looks like a textbook breakdown retest — price revisited the former support (now resistance), failed to reclaim it, and has already started rolling over again.
That rejection strongly suggests sellers are still in control.
At the moment, ZEC is hovering near key moving average, with price struggling near the 200-day MA (~$280) while leaning on lower supports.
What’s Next for ZEC?
If bearish pressure persists, a loss of short-term support of 200-day MA could gradually pull ZEC back toward the $203.55 support zone, which is now back in focus.
A clean breakdown below this level would significantly weaken the overall structure and could trigger a deeper corrective phase — with the major downside target sitting near $76, as projected on the chart.
On the flip side, bears would begin to lose control if buyers manage to reclaim the 100-day moving average around $420. Such a move would signal renewed demand and could ease concerns tied to the descending triangle, at least in the short term.
Final Thoughts
For now, Zcash’s recent rally looks more like a technical retest of a prior breakdown than the start of a fresh uptrend. With the descending triangle still active and price failing at key resistance, the technical outlook remains tilted to the downside.
Unless ZEC can decisively reclaim the $420 region, rallies may continue to face selling pressure — keeping $203 in play and $76 on the radar if broader market weakness deepens.
Disclaimer: The views and analysis presented in this article are for informational purposes only and reflect the author’s perspective, not financial advice. Technical patterns and indicators discussed are subject to market volatility and may or may not yield the anticipated results. Investors are advised to exercise caution, conduct independent research, and make decisions aligned with their individual risk tolerance.
About Author: Nilesh Hembade is the Founder and Lead Author of Coinsprobe, with over 5 years of experience in the cryptocurrency and blockchain industry. Since launching Coinsprobe in 2023, he has been providing daily, research-driven insights through in-depth market analysis, on-chain data, and technical research.

The opinions and market insights shared on CoinsProbe represent the views of individual authors based on prevailing market conditions at the time of publication. Cryptocurrency investments carry significant risk and volatility. Readers are encouraged to conduct their own research and seek professional financial advice before making investment decisions. CoinsProbe and its contributors do not accept responsibility for financial losses or decisions made based on published content.
CoinsProbe may publish sponsored articles, affiliate links, or promotional collaborations. All sponsored material is clearly labeled to maintain transparency with our audience. Our editorial decisions remain fully independent, and advertising partnerships do not influence reviews, rankings, or published opinions.
Since 2023, CoinsProbe has delivered reliable insights on cryptocurrency, blockchain, and digital assets. Our content is created by experienced researchers and analysts who follow strict editorial standards focused on accuracy, transparency, and credibility. Every article is carefully reviewed and verified using trusted sources and current market data. We provide unbiased analysis and timely updates covering everything from emerging crypto projects to major industry developments.