Date: Fri, July 11 2025 | 06:05 AM GMT
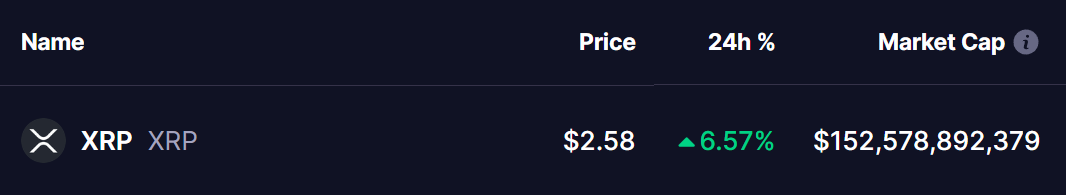
The cryptocurrency market celebrated a major milestone in its history today as Bitcoin (BTC) surged to a fresh all-time high of $118,000. Ethereum (ETH) followed suit with a strong 8% rally, breaking above the $3,000 mark. This bullish momentum is lifting the major altcoins— including XRP, which has gained 6% in the past 24 hours.
But beyond price action, it’s the emergence of a classic harmonic structure on XRP’s chart that’s turning heads and suggesting this move might just be getting started.
Harmonic Pattern Hints at Upside Move
Zooming into XRP’s daily chart, a well-defined ABCD harmonic pattern is clearly in play. The move began in April from point A near $1.61, before a sharp rise took XRP to point B in early May. This was followed by a healthy correction to point C near $1.91 by late June — a typical move that fits the harmonic sequence.
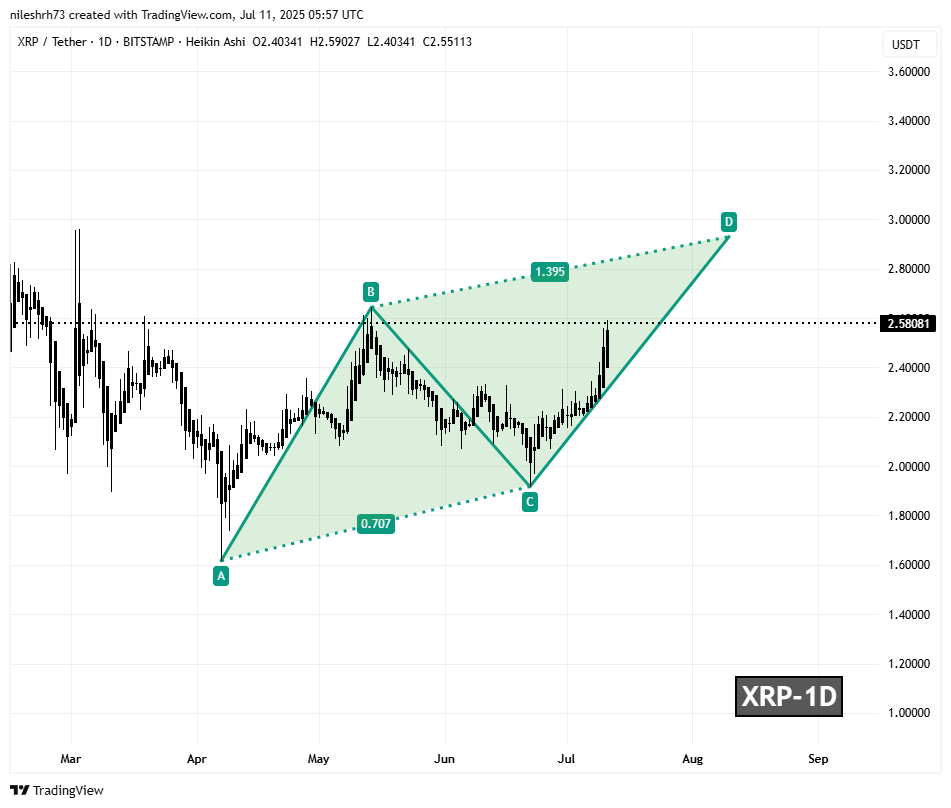
Since then, XRP has been steadily grinding higher, now trading around the $2.58 level. This leg from point C to D is unfolding in a manner consistent with the harmonic roadmap, indicating the final target could be approaching — but not yet reached.
What’s Next for XRP?
If this harmonic pattern completes as expected, the next key level is the Potential Reversal Zone (PRZ) around $2.93. That’s the 1.272 Fibonacci extension from point B, and it represents a potential 13% upside from current levels.
Disclaimer: This article is for informational purposes only and not financial advice. Always conduct your own research before investing in cryptocurrencies.

The opinions and market insights shared on CoinsProbe represent the views of individual authors based on prevailing market conditions at the time of publication. Cryptocurrency investments carry significant risk and volatility. Readers are encouraged to conduct their own research and seek professional financial advice before making investment decisions. CoinsProbe and its contributors do not accept responsibility for financial losses or decisions made based on published content.
CoinsProbe may publish sponsored articles, affiliate links, or promotional collaborations. All sponsored material is clearly labeled to maintain transparency with our audience. Our editorial decisions remain fully independent, and advertising partnerships do not influence reviews, rankings, or published opinions.
Since 2023, CoinsProbe has delivered reliable insights on cryptocurrency, blockchain, and digital assets. Our content is created by experienced researchers and analysts who follow strict editorial standards focused on accuracy, transparency, and credibility. Every article is carefully reviewed and verified using trusted sources and current market data. We provide unbiased analysis and timely updates covering everything from emerging crypto projects to major industry developments.