
Date: Sat, March 29, 2025 | 12:34 PM GMT
The cryptocurrency market has quickly reversed its weekly recovery, with Ethereum (ETH) dropping over 7% in the past 48 hours, falling to $1,850. This sell-off has triggered broader weakness across altcoins, including XRP, which has declined more than 5% today, erasing its recent gains.

XRP at a Critical Support Level
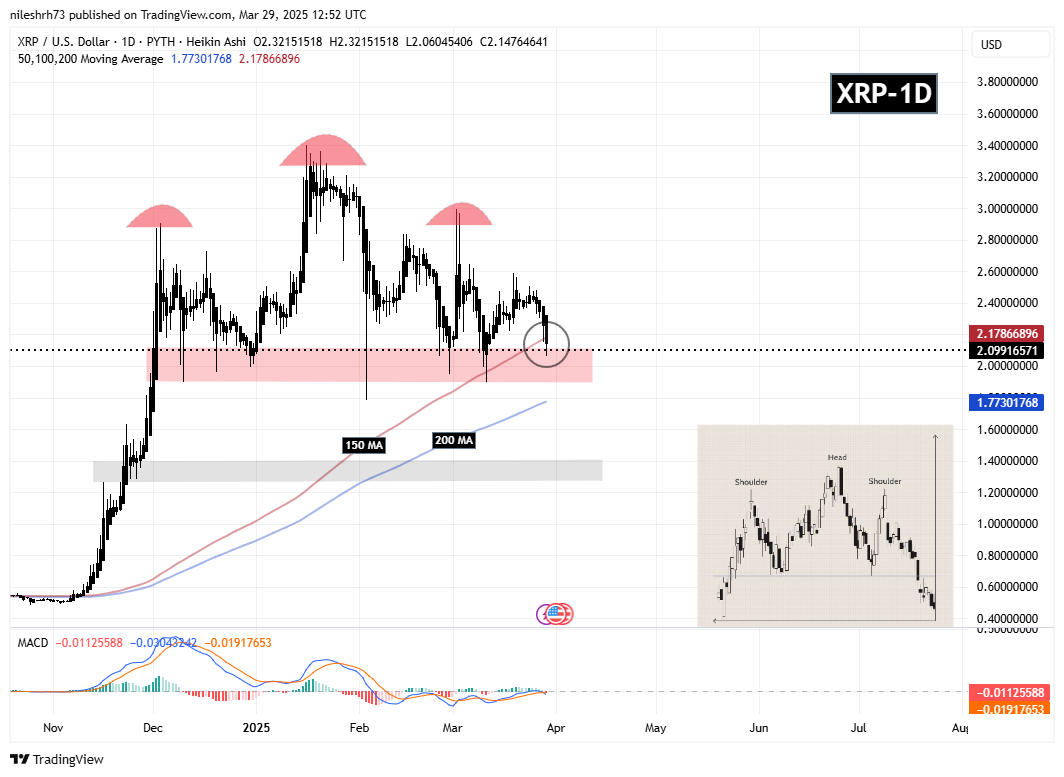
On the daily chart, XRP has formed a Head and Shoulders pattern, a traditionally bearish setup. Today’s drop pushed it below the 150-day moving average (MA) at $2.17, sending it to a critical support zone between $1.90 and $2.11—a level that has historically prevented breakdowns. Currently, XRP is trading near the upper boundary at $2.09.
What’s Next for XRP?
While the Head and Shoulders pattern suggests further downside risk, Bitcoin dominance (BTC.D) will play a key role in shaping the market direction.

BTC dominance has rebounded from both the 50-day MA and rising wedge support, climbing from 61.34% to 62.04%. As BTC dominance nears its resistance trendline, two scenarios could unfold:
- Rejection at Resistance – If BTC.D gets rejected from its resistance trendline, altcoins like XRP could see a relief bounce.
- Breakout Above Resistance – If BTC dominance breaks out, it could trigger another wave of selling pressure on altcoins, including XRP, potentially leading to further downside.
For now, traders should watch XRP’s $1.90-$2.11 support zone and BTC dominance resistance for the next move.

Disclaimer: This article is for informational purposes only and not financial advice. Always conduct your own research before investing in cryptocurrencies.

The opinions and market insights shared on CoinsProbe represent the views of individual authors based on prevailing market conditions at the time of publication. Cryptocurrency investments carry significant risk and volatility. Readers are encouraged to conduct their own research and seek professional financial advice before making investment decisions. CoinsProbe and its contributors do not accept responsibility for financial losses or decisions made based on published content.
CoinsProbe may publish sponsored articles, affiliate links, or promotional collaborations. All sponsored material is clearly labeled to maintain transparency with our audience. Our editorial decisions remain fully independent, and advertising partnerships do not influence reviews, rankings, or published opinions.
Since 2023, CoinsProbe has delivered reliable insights on cryptocurrency, blockchain, and digital assets. Our content is created by experienced researchers and analysts who follow strict editorial standards focused on accuracy, transparency, and credibility. Every article is carefully reviewed and verified using trusted sources and current market data. We provide unbiased analysis and timely updates covering everything from emerging crypto projects to major industry developments.