
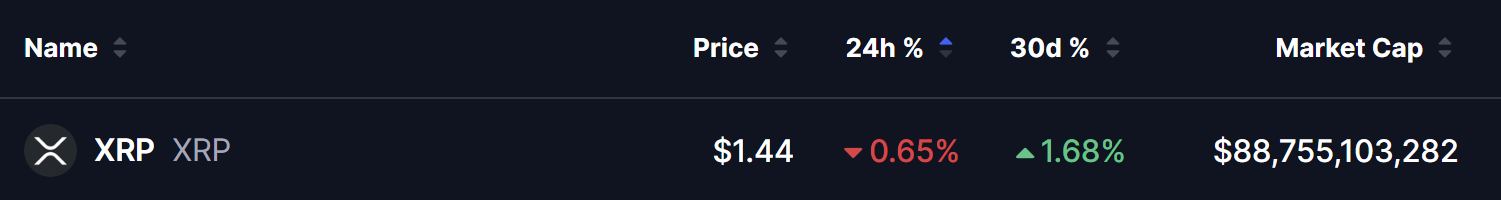
- XRP is trading at $1.44, consolidating for over a month — down 0.65% in 24 hours with a market cap of $88.75 billion.
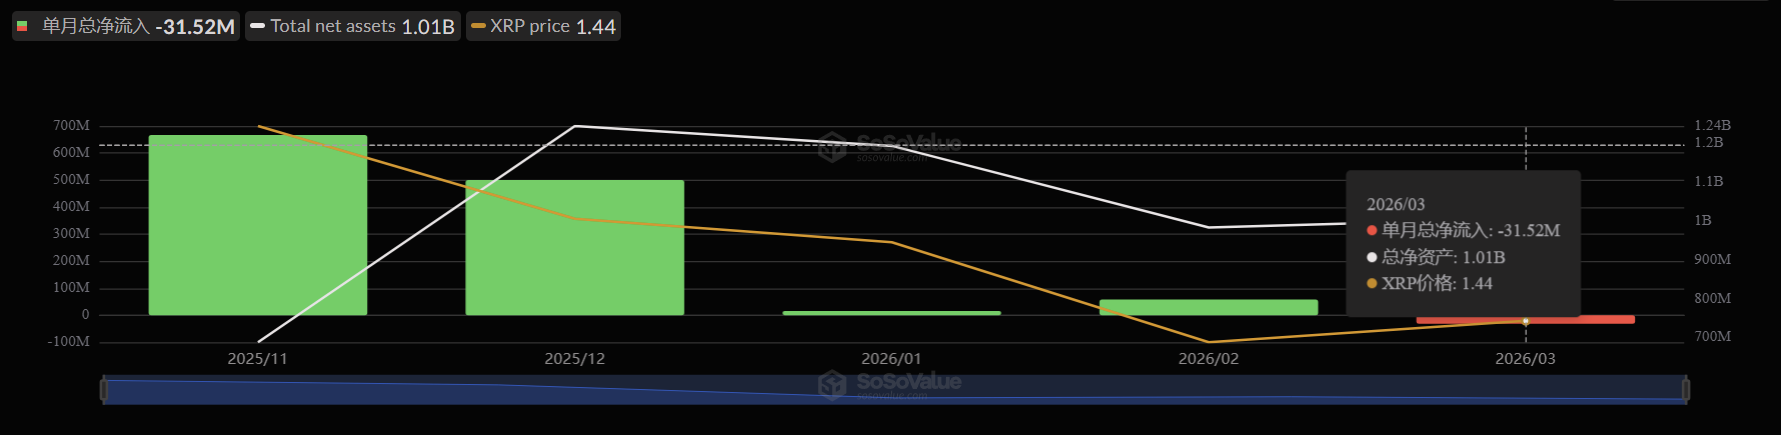
- XRP Spot ETF recorded -$31.52 million in monthly outflows in March 2026, with total net assets falling to $1.01 billion — signaling weakening institutional sentiment.
- A symmetrical triangle has formed on the daily chart with price approaching the apex — breakout or breakdown decision is imminent.
- Breakout above $1.58 targets $2.1679 (+36.66%) — breakdown below $1.4178 targets $0.8869 (-38.75%).
XRP is currently trading at $1.44 as of March 21, 2026, with a market capitalization of approximately $88.75 billion — keeping it firmly among the top five largest cryptocurrencies by market cap despite a prolonged period of consolidation.
The short-term price metrics tell a story of indecision. XRP is down a marginal 0.65% over the past 24 hours while posting a modest 1.68% gain over the past 30 days — numbers that reflect more than a month of sideways price action with no clear directional conviction from either buyers or sellers.
This kind of tight consolidation after a sharp move is not unusual for XRP, which has historically alternated between explosive directional moves and extended periods of range-bound trading. However, the current consolidation is occurring at a technically significant juncture — and the data surrounding XRP’s spot ETF flows is beginning to add a layer of caution to the outlook.
XRP Spot ETF — Declining Flows Signal Weakening Sentiment
One of the most significant data points in XRP’s current setup comes not from the price chart but from its spot ETF flow data, tracked by SoSoValue.
XRP spot ETFs — which launched in late 2025 and initially attracted strong institutional inflows — have seen a notable reversal in momentum heading into March 2026.
The data shows the following flow trend:
- November 2025: Strong inflows of approximately $650 million — peak institutional demand as ETFs launched
- December 2025: Continued inflows of approximately $500 million — healthy follow-through
- January 2026: Inflows dropped sharply to near zero — first sign of demand cooling
- February 2026: Small positive inflows returned briefly — approximately $50 million
- March 2026: Net outflows of -$31.52 million — the first negative monthly flow since launch
The total net assets of XRP spot ETFs have declined from a peak of approximately $1.24 billion to the current $1.01 billion — a drop of roughly 18.5% in AUM over the past three months.
This deterioration in ETF flow momentum is a meaningful sentiment indicator. When institutional money begins flowing out of a crypto ETF product, it suggests that short-term demand from that buyer cohort is fading — removing a key source of buying pressure that helped support XRP’s price during the November–December 2025 rally.
The ETF outflow data does not guarantee a price decline, but combined with the technical picture forming on the chart, it adds meaningful weight to the cautious side of the setup.
Symmetrical Triangle — Decision Point Approaching
On the daily chart, XRP has formed a clear symmetrical triangle pattern — one of the most recognizable and well-studied continuation or reversal structures in technical analysis.
The pattern has developed over approximately two months since February 2026:
- Upper trendline: Connecting the highs at $1.6713 (February) and $1.6068 (March) — a series of lower highs showing declining bullish momentum
- Lower trendline: Connecting the lows at $1.1102 (February) and $1.2702 (March) — a series of higher lows showing buyers stepping in at progressively higher levels
- Apex: The two trendlines are converging rapidly, with price now trading near $1.44 — approaching the apex of the triangle
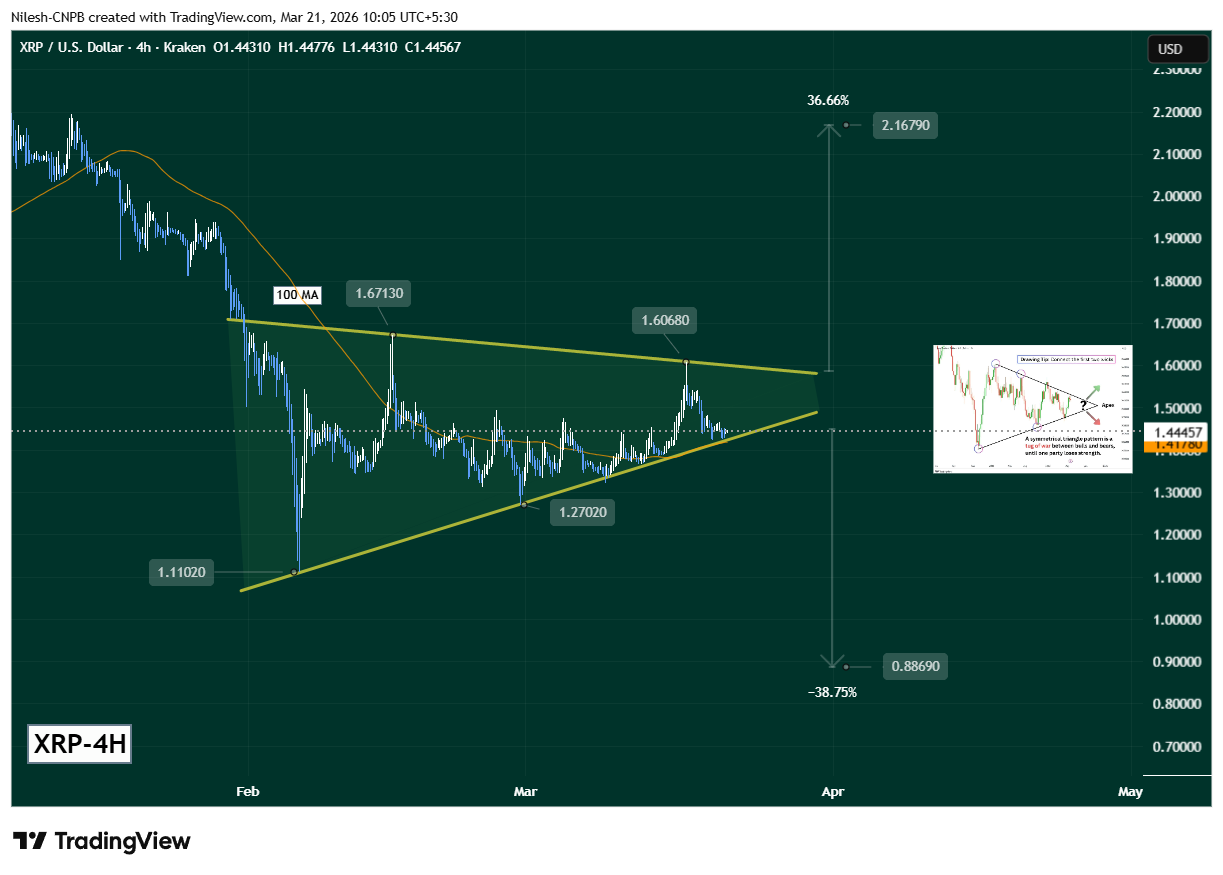
The 100-hour moving average, currently sitting at $1.4178, is now acting as immediate dynamic support — a level that has become critical to the short-term direction of the pattern. Price is compressing between the upper resistance trendline near $1.58 and the lower support trendline converging with the 100-hour MA at $1.4178.
4. What’s Next for XRP?
XRP is approaching one of its most technically significant junctures in recent months. The symmetrical triangle is tightening, the apex is near, and the ETF flow data is adding a bearish lean to the setup.
The Measured Move Targets
If the triangle resolves to the upside with a break above $1.58:
- Confirmation: Daily close above the upper resistance trendline near $1.58
- Intermediate resistance: $1.6068 → $1.6713
- Full measured move target: $2.1679 — a +36.66% move from the breakout point
If the triangle resolves to the downside with a break below $1.4178:
- Trigger: Daily close below the lower support trendline AND the 100-hour MA at $1.4178
- Intermediate support: $1.2702 → $1.1102
- Full measured move target: $0.8869 — a -38.75% move from the breakdown point
Bearish Scenario — The Higher Probability Setup
Given the current weight of evidence, the bearish scenario carries slightly higher probability than the bullish case:
Why the breakdown looks more likely:
The combination of declining ETF flows (-$31.52M in March), fading institutional demand (AUM dropping from $1.24B to $1.01B), and the 100-hour MA at $1.4178 now acting as the last line of defense all point toward a setup where sellers have the upper hand. Each rally attempt since February has been met with selling at lower highs — a classic distribution pattern consistent with the triangle’s upper trendline compression.
If XRP breaks below the lower support trendline AND the 100-hour MA at $1.4178 on a daily close, the breakdown is confirmed. The measured move target of $0.8869 — a 38.75% decline — then comes into focus, bringing XRP back toward the strong historical support zone that preceded its 2025 rally.
Bullish Scenario — What Would Change the Picture
For the bullish case to take over, XRP needs:
Step 1 — Hold above the 100-hour MA at $1.4178. This is the immediate critical level. The 100-hour MA at $1.4178 is now converging with the lower support trendline — making it the most important short-term defense for bulls. A daily close below this level triggers the breakdown scenario.
Step 2 — Break above upper resistance trendline near $1.58. A sustained daily close above the $1.58 upper resistance trendline would confirm the bullish breakout from the symmetrical triangle. This is the key trigger level — not just any move above current price, but specifically a close above this descending trendline that has capped every rally since February.
Step 3 — Target $1.6068 → $1.6713 → $2.1679. Sequential reclaim of these levels would confirm the full bullish measured move is in play. The $2.1679 target — a 36.66% move from the breakout point — would represent new cycle highs for XRP and a full invalidation of the bearish thesis.
A reversal in ETF flow data — returning to positive monthly inflows — would significantly strengthen the bullish case and suggest institutional demand is returning to support the move.
Frequently Asked Questions
What is a symmetrical triangle pattern?
A symmetrical triangle is a chart pattern formed by two converging trendlines — a descending upper trendline connecting lower highs and an ascending lower trendline connecting higher lows. It represents a period of consolidation where neither buyers nor sellers have control. As the pattern reaches its apex, price is typically forced into a sharp directional breakout. The measured move target equals the height of the triangle’s widest point projected from the breakout level.
What are XRP Spot ETFs and why do their flows matter?
XRP Spot ETFs are exchange-traded funds that hold actual XRP tokens, allowing institutional investors to gain exposure to XRP through regulated financial products without holding crypto directly. Their flow data — how much money is entering or leaving — serves as a proxy for institutional sentiment. When flows turn negative, it signals that institutional buyers are reducing their XRP exposure, which removes a key source of demand that helped drive the late 2025 rally.
Why is the 100-hour MA at $1.4178 so critical for XRP right now?
The 100-hour moving average at $1.4178 is converging with the lower support trendline of the symmetrical triangle — creating a double support confluence at the same price level. When two technical support factors align at the same level, a break below both simultaneously carries significantly more bearish weight than a break of either level alone. This makes $1.4178 the single most important level to watch in the near term.
What confirms the bullish breakout for XRP?
A daily close above the upper resistance trendline near $1.58 with strong volume would confirm the bullish breakout from the symmetrical triangle. This would open the path toward $1.6068, $1.6713, and ultimately the $2.1679 measured move target — particularly if accompanied by a reversal in ETF flows back to positive territory.
What is XRP’s market cap and where does it rank?
XRP has a market capitalization of approximately $88.75 billion as of March 21, 2026, making it the fourth largest cryptocurrency globally. Despite the current consolidation, XRP’s market cap has remained resilient, reflecting continued long-term confidence in the Ripple ecosystem and its role in cross-border payment infrastructure.

The opinions and market insights shared on CoinsProbe represent the views of individual authors based on prevailing market conditions at the time of publication. Cryptocurrency investments carry significant risk and volatility. Readers are encouraged to conduct their own research and seek professional financial advice before making investment decisions. CoinsProbe and its contributors do not accept responsibility for financial losses or decisions made based on published content.
CoinsProbe may publish sponsored articles, affiliate links, or promotional collaborations. All sponsored material is clearly labeled to maintain transparency with our audience. Our editorial decisions remain fully independent, and advertising partnerships do not influence reviews, rankings, or published opinions.
Since 2023, CoinsProbe has delivered reliable insights on cryptocurrency, blockchain, and digital assets. Our content is created by experienced researchers and analysts who follow strict editorial standards focused on accuracy, transparency, and credibility. Every article is carefully reviewed and verified using trusted sources and current market data. We provide unbiased analysis and timely updates covering everything from emerging crypto projects to major industry developments.