Date: Sun, April 27, 2025 | 05:42 AM GMT
After a rough start to 2025, where even Ethereum (ETH) tanked by 45% in Q1, the crypto market is finally flashing signs of life. Bitcoin (BTC) has surged by over 10%, while ETH is up 11% over the past week, and this bullish momentum is now spilling over into major altcoins.
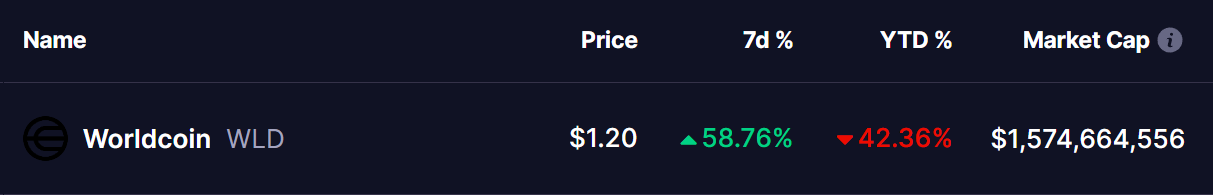
One such altcoin making a strong comeback is Worldcoin (WLD). After experiencing a heavy sell-off, WLD has surged by nearly 57% over the past week — cutting its year-to-date losses down to about 42%. Now, it’s approaching a key resistance that could decide its next major move, as a crucial fractal setup is taking shape.
WLD Mirrors DOT’s Fractal Analysis
When comparing WLD’s current price action with Polkadot’s (DOT) movement from April 2022, some striking similarities pop up. Back then, DOT had formed a clear cup and handle pattern before breaking down. It rallied up to a key resistance zone (marked in the circle) but got rejected hard. This rejection, combined with a breakdown below its 100-day moving average, triggered a sharp downtrend that sent prices much lower.
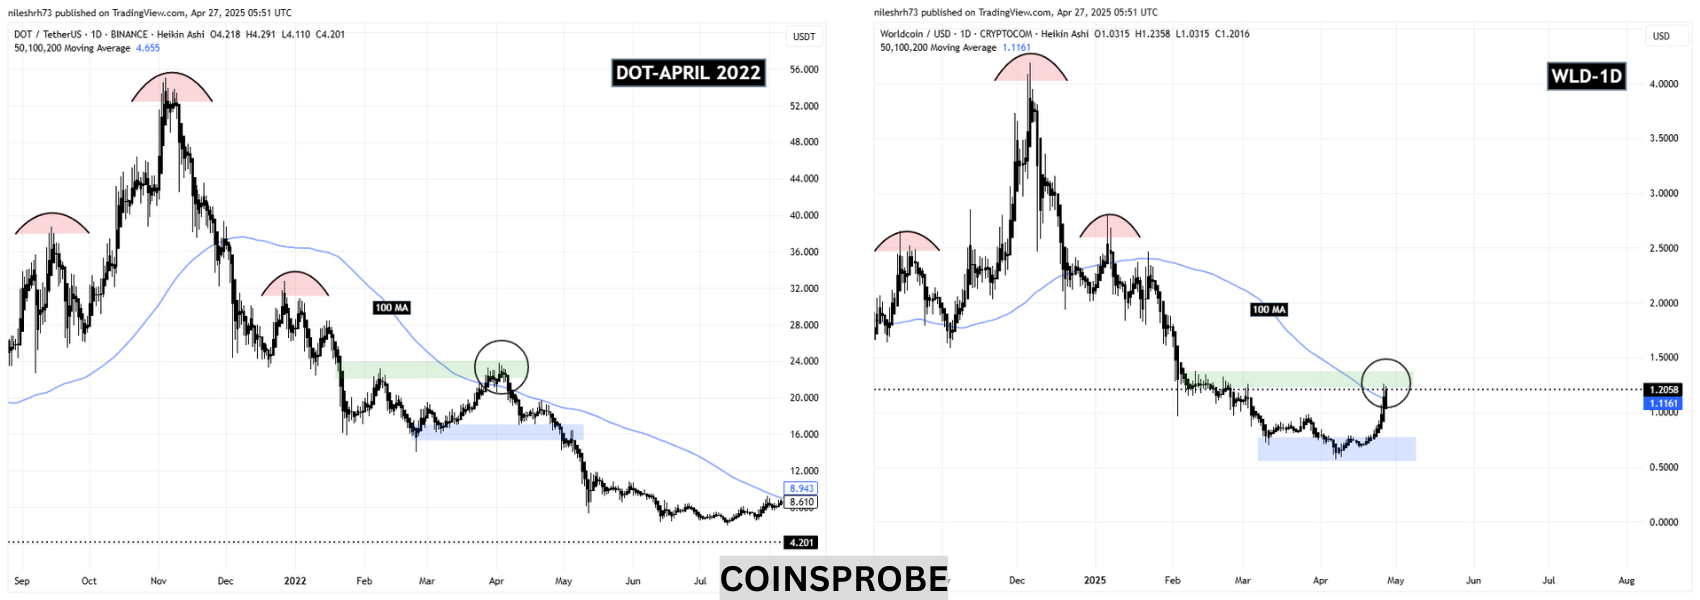
Now, zooming into WLD’s chart, the situation feels eerily familiar. WLD is currently approaching the green-marked resistance zone around $1.28, while also hovering near its 100-day moving average — just like DOT did back in 2022. The setup looks almost identical, with WLD trading near the key circle zone, raising concerns of a potential rejection.
From here, if buyers manage to push WLD above the resistance zone and sustain the breakout, it would effectively “break” this bearish fractal pattern and could open doors for a bigger rally. However, if WLD faces rejection from this resistance and falls back below the 100-day moving average, a downside move towards the blue support zone near $0.75 becomes very likely.

The coming days will be critical for WLD holders, as price action around this resistance could decide whether the recovery continues — or if another painful correction is on the horizon.
Disclaimer: This article is for informational purposes only and not financial advice. Always conduct your own research before investing in cryptocurrencies.

The opinions and market insights shared on CoinsProbe represent the views of individual authors based on prevailing market conditions at the time of publication. Cryptocurrency investments carry significant risk and volatility. Readers are encouraged to conduct their own research and seek professional financial advice before making investment decisions. CoinsProbe and its contributors do not accept responsibility for financial losses or decisions made based on published content.
CoinsProbe may publish sponsored articles, affiliate links, or promotional collaborations. All sponsored material is clearly labeled to maintain transparency with our audience. Our editorial decisions remain fully independent, and advertising partnerships do not influence reviews, rankings, or published opinions.
Since 2023, CoinsProbe has delivered reliable insights on cryptocurrency, blockchain, and digital assets. Our content is created by experienced researchers and analysts who follow strict editorial standards focused on accuracy, transparency, and credibility. Every article is carefully reviewed and verified using trusted sources and current market data. We provide unbiased analysis and timely updates covering everything from emerging crypto projects to major industry developments.