Date: Sun, May 04, 2025 | 06:56 AM GMT
After a rough start to 2025—where even Ethereum (ETH) slumped by 45% in Q1—the crypto market is finally showing signs of life. ETH has bounced back by over 32% from its April 7th low, and this bullish energy is spilling over into major tokens as well.
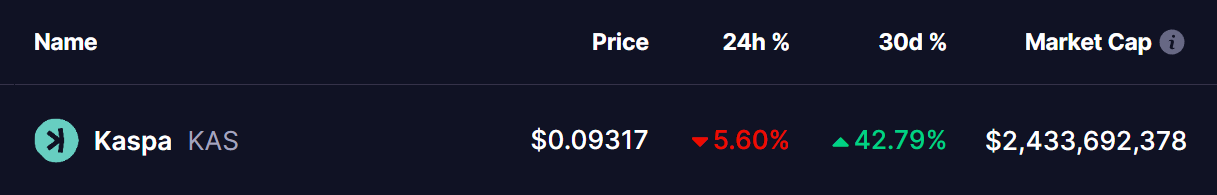
However, among altcoins today, Kaspa (KAS), after making a strong rebound of 42% in the last 30 days, is trading slightly in the red, down by over 5%. Despite this temporary pullback, a promising fractal pattern might just clear the fog about Kaspa’s potential next move.
Kaspa (KAS) Mirrors Past Breakout Setup
A closer look at the KAS 1-day chart reveals something interesting. On the left side of the chart, which shows the June–July 2023 setup, KAS was stuck in a prolonged downtrend marked by a clear descending trendline. After weeks of grinding lower, it finally stabilized within a grey accumulation zone.
What followed was a breakout above both the 50-day and 100-day moving averages—signals that confirmed a shift in momentum. The breakout was followed by a small pullback (highlighted in red), before KAS took off in a steep rally, gaining more than 150% with in a month.
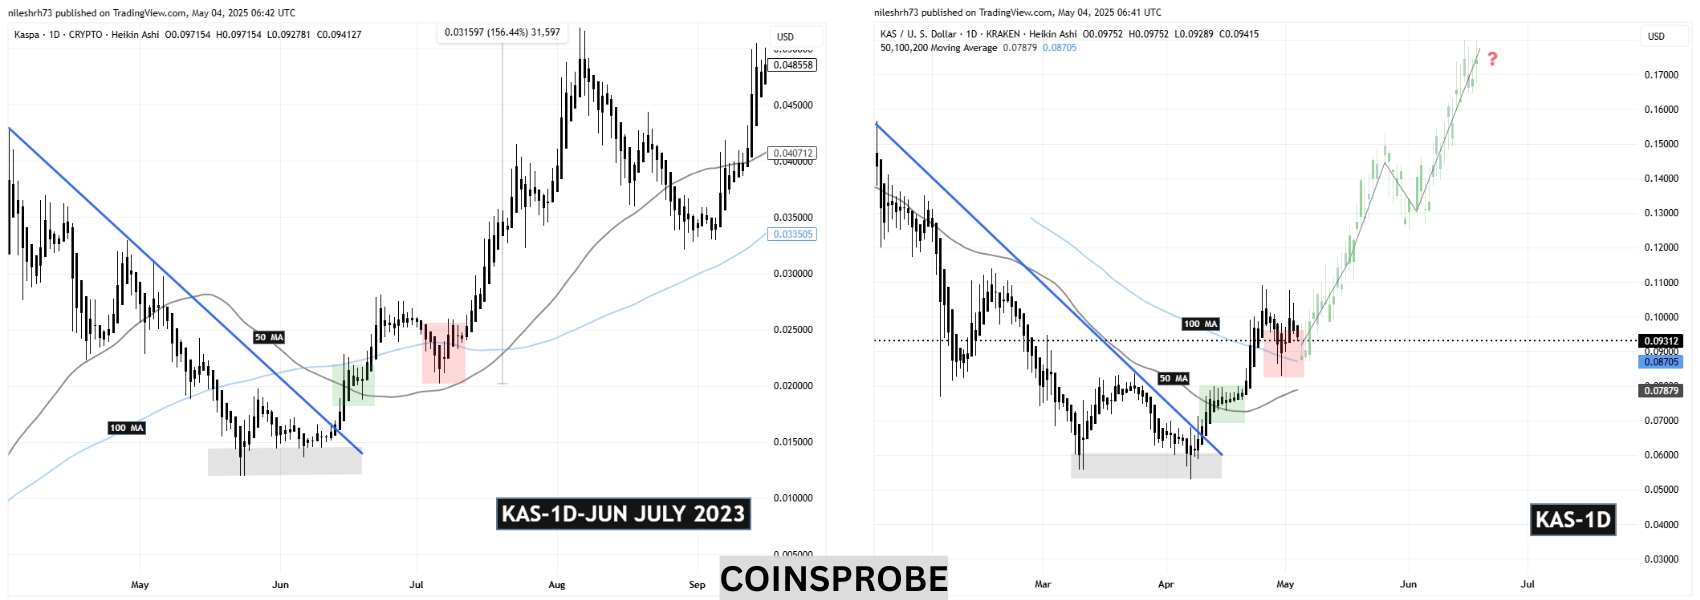
Fast forward to the present, and the pattern is eerily similar. The right side of the chart shows the current 2025 price action: another steep downtrend, another grey accumulation base, and another breakout above the 50-day and 100-day moving averages.
Just like before, the breakout was followed by a red zone pullback where the price is currently trading at $0.092, suggesting that history could be repeating itself—if it makes a bounce.
What’s Ahead?
If KAS continues to follow this fractal structure, the price could be on track to hit the $0.17 to $0.19 range in the coming weeks marked in green projection lines—a move that would represent a further 90% gain from the current level.
That said, caution is warranted. If the price fails to hold support of 100-day MA and the level of $0.08292, it could be the first early warning sign that this bullish setup is starting to weaken. A break below that level might invalidate the fractal pattern and suggest that more consolidation is needed before any real upside can resume.
For now, Kaspa traders and fractal watchers alike will be paying close attention. History might not repeat exactly—but it often rhymes.
Disclaimer: This article is for informational purposes only and not financial advice. Always conduct your own research before investing in cryptocurrencies.

The opinions and market insights shared on CoinsProbe represent the views of individual authors based on prevailing market conditions at the time of publication. Cryptocurrency investments carry significant risk and volatility. Readers are encouraged to conduct their own research and seek professional financial advice before making investment decisions. CoinsProbe and its contributors do not accept responsibility for financial losses or decisions made based on published content.
CoinsProbe may publish sponsored articles, affiliate links, or promotional collaborations. All sponsored material is clearly labeled to maintain transparency with our audience. Our editorial decisions remain fully independent, and advertising partnerships do not influence reviews, rankings, or published opinions.
Since 2023, CoinsProbe has delivered reliable insights on cryptocurrency, blockchain, and digital assets. Our content is created by experienced researchers and analysts who follow strict editorial standards focused on accuracy, transparency, and credibility. Every article is carefully reviewed and verified using trusted sources and current market data. We provide unbiased analysis and timely updates covering everything from emerging crypto projects to major industry developments.