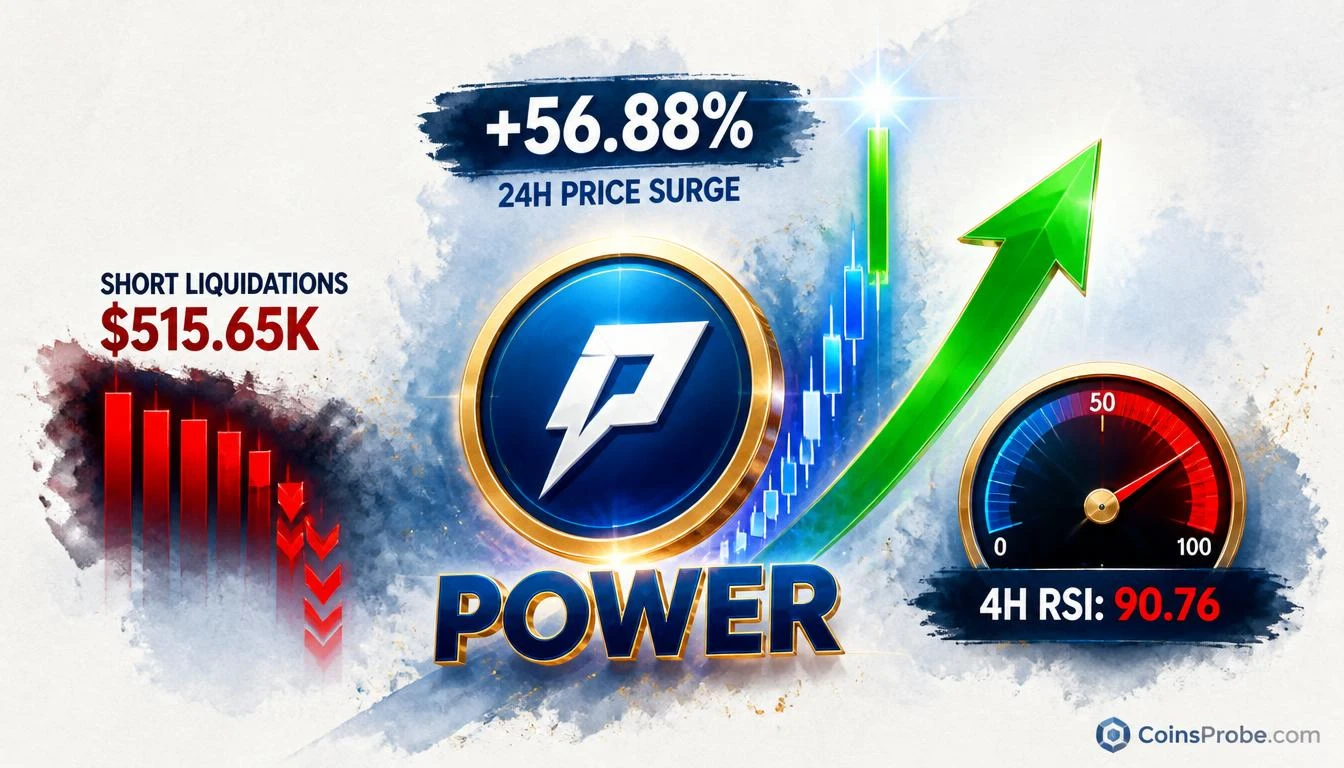

- POWER surges 56.88% in 24 hours to $0.1920, with a 14.93% spike in the past hour alone per Coinglass
- $515.65K in short liquidations cascade through $31.04M open interest — 0.77x the $40.56M market cap
- RSI hits 90.76 on the 4-hour and 90.51 on the daily — extreme momentum across all timeframes simultaneously
- Funding rate stays at 0.0051% despite the surge — confirming squeeze is short-exit driven, not fresh long demand
BREAKING
A short squeeze — not organic buying — is the primary driver behind POWER’s 56.88% surge in the past 24 hours. Coinglass data recorded $515.65K in liquidations over the same window, with the dominant side tagged as short, confirming that overleveraged short positions were forcibly closed as price spiked — amplifying the move mechanically.
At the time of writing, POWER is trading at approximately $0.1920, up 56.88% in the past 24 hours and 14.93% in the past hour alone. Market cap sits at $40.56M. Data via Coinglass.
The Mechanism — Short Liquidations Cascading Into Price
POWER entered the session with $31.04M in open interest — a figure that dwarfs its $40.56M market cap by a ratio of approximately 0.77x. That level of open interest relative to market cap signals a heavily leveraged derivatives market positioned around a relatively thin spot base. When price moved upward, short positions with insufficient margin were auto-liquidated by exchanges, forcing market buys that pushed price higher — triggering the next layer of liquidations in a cascade.
| Metric | Value |
|---|---|
| Price | $0.1920 |
| 24h Price Change | +56.88% |
| 1h Price Change | +14.93% |
| 24h Volume | $142.62M |
| Open Interest | $31.04M |
| Funding Rate | 0.0051% |
| 24h Liquidations | $515.65K |
| RSI (1h / 4h / 1d) | 83.19 / 90.76 / 90.51 |
Source: Coinglass, September 15, 2026
Why Short Liquidations Flow Directly Into Price Acceleration
In a short squeeze, the mechanism is self-reinforcing: short sellers borrow and sell an asset expecting a price decline. When price rises instead, exchange margin systems auto-close those positions via forced market buys. Each forced buy pushes price higher, triggering the next layer of stops. With $142.62M in 24-hour volume against a $40.56M market cap — a volume-to-cap ratio exceeding 3.5x — the derivatives tail is visibly wagging the spot dog here.
The funding rate at 0.0051% is notably low despite the price surge, which is itself a signal worth examining. A dramatically rising asset with low funding suggests the long side has not yet fully repiled — meaning the squeeze is being driven by short exits, not fresh long entries chasing momentum. This is a structurally important distinction: it suggests the move is liquidation-led rather than demand-led at this stage. This dynamic mirrors what was observed in the VTHO 14% surge, where funding and liquidation data told a clearer story than price alone.
RSI at 90+ — What Extreme Momentum Readings Signal
The RSI across all three timeframes is flashing extreme readings: 83.19 on the 1-hour, 90.76 on the 4-hour, and 90.51 on the daily. RSI measures the speed and magnitude of recent price changes on a 0–100 scale — readings above 70 are conventionally considered overbought. Readings above 90 across multiple timeframes simultaneously indicate momentum that has moved far beyond normal trading ranges in a compressed timeframe.
This does not confirm a reversal — momentum can remain extreme in genuine breakouts. But it does confirm that the move is statistically unusual and that buyers entering at current levels are doing so at a point of maximum recent stress on the indicator. Assets similar to this setup — such as ICP’s open interest-to-market-cap imbalance — have shown that elevated OI relative to cap creates post-squeeze volatility in both directions.
Is the POWER Rally Sustainable?
The key question is whether organic demand follows the forced liquidation cascade. The funding rate at 0.0051% needs to be watched for a reset — if it climbs sharply above 0.05% to 0.10%, it would indicate leveraged longs piling in after the squeeze, which historically precedes sharp pullbacks when those positions unwind. If funding stays suppressed while price consolidates above a new local support, it would indicate genuine spot accumulation absorbing the move.
The $142.62M in 24-hour volume must be contextualized: volume at 3.5x market cap in a single day is not normal trading activity — it reflects derivatives-driven churn. Sustaining the price level requires that volume normalize into a range consistent with organic holder activity, not forced position closure. The metric to track is Coinglass’s real-time open interest figure for POWER — a decline in OI while price holds would confirm deleveraging is complete and spot is supporting the level.
Bottom line: POWER’s 56.88% surge in 24 hours is mechanically explained by $515.65K in short liquidations cascading through a derivatives market carrying $31.04M in open interest against a $40.56M market cap. The 14.93% single-hour spike confirms the squeeze was still active at the time of this writing. RSI readings of 90+ across 1h, 4h, and daily confirm momentum extremity. Whether the level holds depends entirely on what follows the forced exits — watch Coinglass’s open interest for POWER in real time: a sustained OI decline paired with stable price is the confirmation that spot demand, not liquidation mechanics, is now holding the move.
Frequently Asked Questions
Why is POWER surging 56.88% today?
What does POWER’s open interest relative to market cap mean?
Why is POWER’s funding rate so low if the price is surging?
What metric should I track to know if POWER’s rally is sustainable?
Source: Coinglass +1 More · Published by CoinsProbe Markets Desk
The opinions and market insights shared on CoinsProbe represent the views of individual authors based on prevailing market conditions at the time of publication. Cryptocurrency investments carry significant risk and volatility. Readers are encouraged to conduct their own research and seek professional financial advice before making investment decisions. CoinsProbe and its contributors do not accept responsibility for financial losses or decisions made based on published content.
CoinsProbe may publish sponsored articles, affiliate links, or promotional collaborations. All sponsored material is clearly labeled to maintain transparency with our audience. Our editorial decisions remain fully independent, and advertising partnerships do not influence reviews, rankings, or published opinions.
Since 2023, CoinsProbe has delivered reliable insights on cryptocurrency, blockchain, and digital assets. Our content is created by experienced researchers and analysts who follow strict editorial standards focused on accuracy, transparency, and credibility. Every article is carefully reviewed and verified using trusted sources and current market data. We provide unbiased analysis and timely updates covering everything from emerging crypto projects to major industry developments.