
Date: Sun, Dec 07, 2025 | 05:44 PM GMT
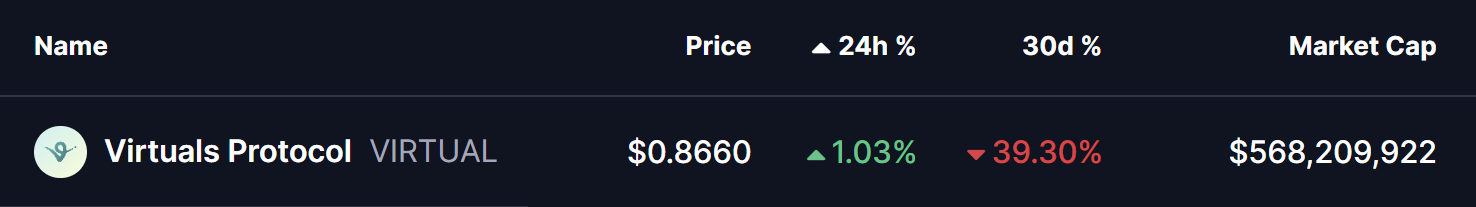
The broader altcoin market is still struggling to regain strong momentum, and Virtuals Protocol (VIRTUAL) has not been an exception. Over the last 30 days, the token has seen a sharp correction of nearly 39%, pushing price action into deeply discounted territory. However, the latest chart structure is starting to flash early bullish recovery signals.
Double Bottom Pattern Taking Shape
On the daily timeframe, VIRTUAL appears to be forming a classic double-bottom pattern — a structure that often signals a potential trend reversal after a prolonged downtrend.
The bearish phase began when the token failed to break above the $1.01 resistance zone in early November. That rejection triggered heavy selling pressure, sending the price down by more than 20% and dragging it back toward the crucial $0.4075 support area, which now acts as the second bottom of the pattern.
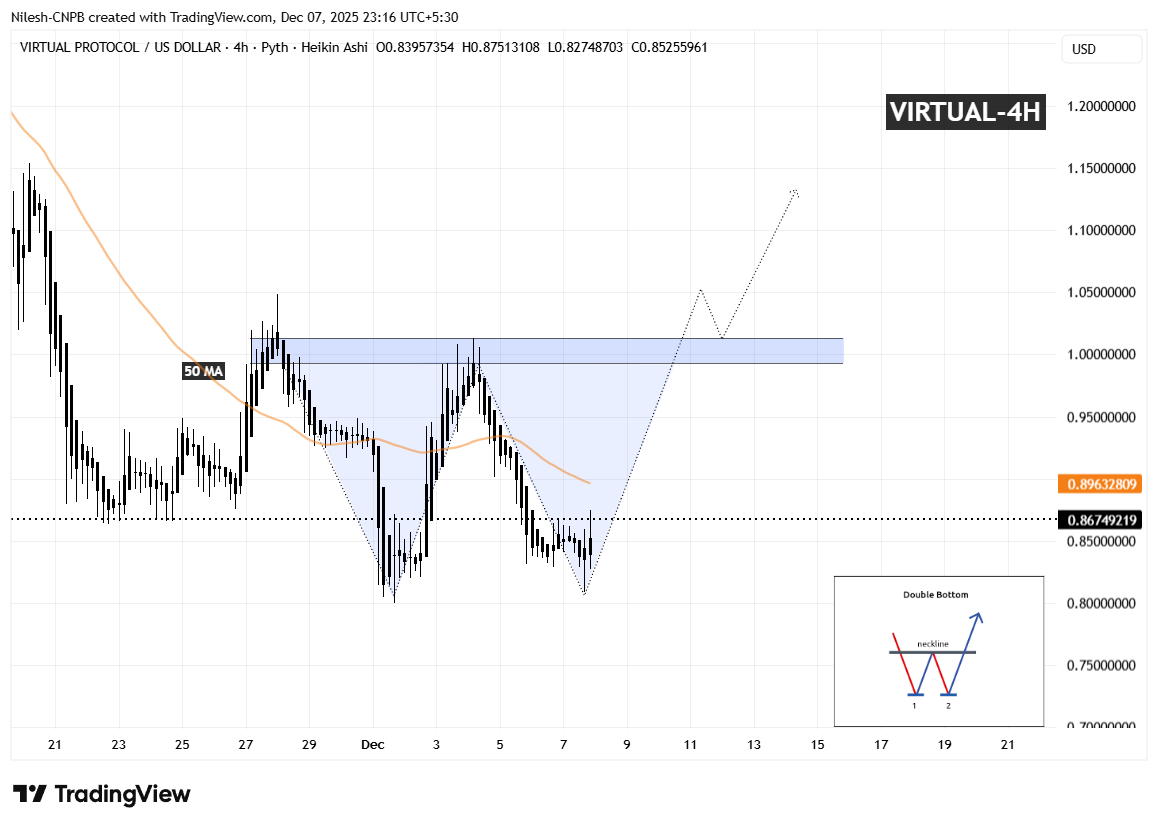
Multiple reactions from this zone suggest that buyers are stepping in aggressively, defending this area and preventing further breakdowns.
The latest rebound toward $0.8674 reflects growing buying interest and signals that bearish momentum may be weakening as demand slowly starts to outweigh selling pressure.
What’s Next for VIRTUAL?
The most important level to monitor now is the 50-period Moving Average, currently sitting near $0.8963.
A clean breakout and strong hold above this moving average could confirm the double-bottom structure. If that happens, VIRTUAL could target a move back toward the $1.01 region, suggesting a potential recovery of around 16% from current price levels.
However, the bullish outlook comes with a clear invalidation point. If price fails to hold the $0.80 support zone and breaks below it decisively, the pattern would likely be invalidated, increasing the risk of another leg to the downside before any sustainable recovery.
Disclaimer: The views and analysis presented in this article are for informational purposes only and reflect the author’s perspective, not financial advice. Technical patterns and indicators discussed are subject to market volatility and may or may not yield the anticipated results. Investors are advised to exercise caution, conduct independent research, and make decisions aligned with their individual risk tolerance.

The opinions and market insights shared on CoinsProbe represent the views of individual authors based on prevailing market conditions at the time of publication. Cryptocurrency investments carry significant risk and volatility. Readers are encouraged to conduct their own research and seek professional financial advice before making investment decisions. CoinsProbe and its contributors do not accept responsibility for financial losses or decisions made based on published content.
CoinsProbe may publish sponsored articles, affiliate links, or promotional collaborations. All sponsored material is clearly labeled to maintain transparency with our audience. Our editorial decisions remain fully independent, and advertising partnerships do not influence reviews, rankings, or published opinions.
Since 2023, CoinsProbe has delivered reliable insights on cryptocurrency, blockchain, and digital assets. Our content is created by experienced researchers and analysts who follow strict editorial standards focused on accuracy, transparency, and credibility. Every article is carefully reviewed and verified using trusted sources and current market data. We provide unbiased analysis and timely updates covering everything from emerging crypto projects to major industry developments.