Date: Mon, Oct 28, 2024, 06:32 AM GMT
In the cryptocurrency market, the bearish performance of top layer 1 tokens SUI and APT continues, despite corrections from recent highs. SUI has dropped almost 30% from its recent peak of $2.36, while APT is down by 21% from its recent high of $11.22.
Over the past week, both tokens have disappointed investors, marking significant declines of 19% and 13%, respectively.

Sui (SUI) Analysis:
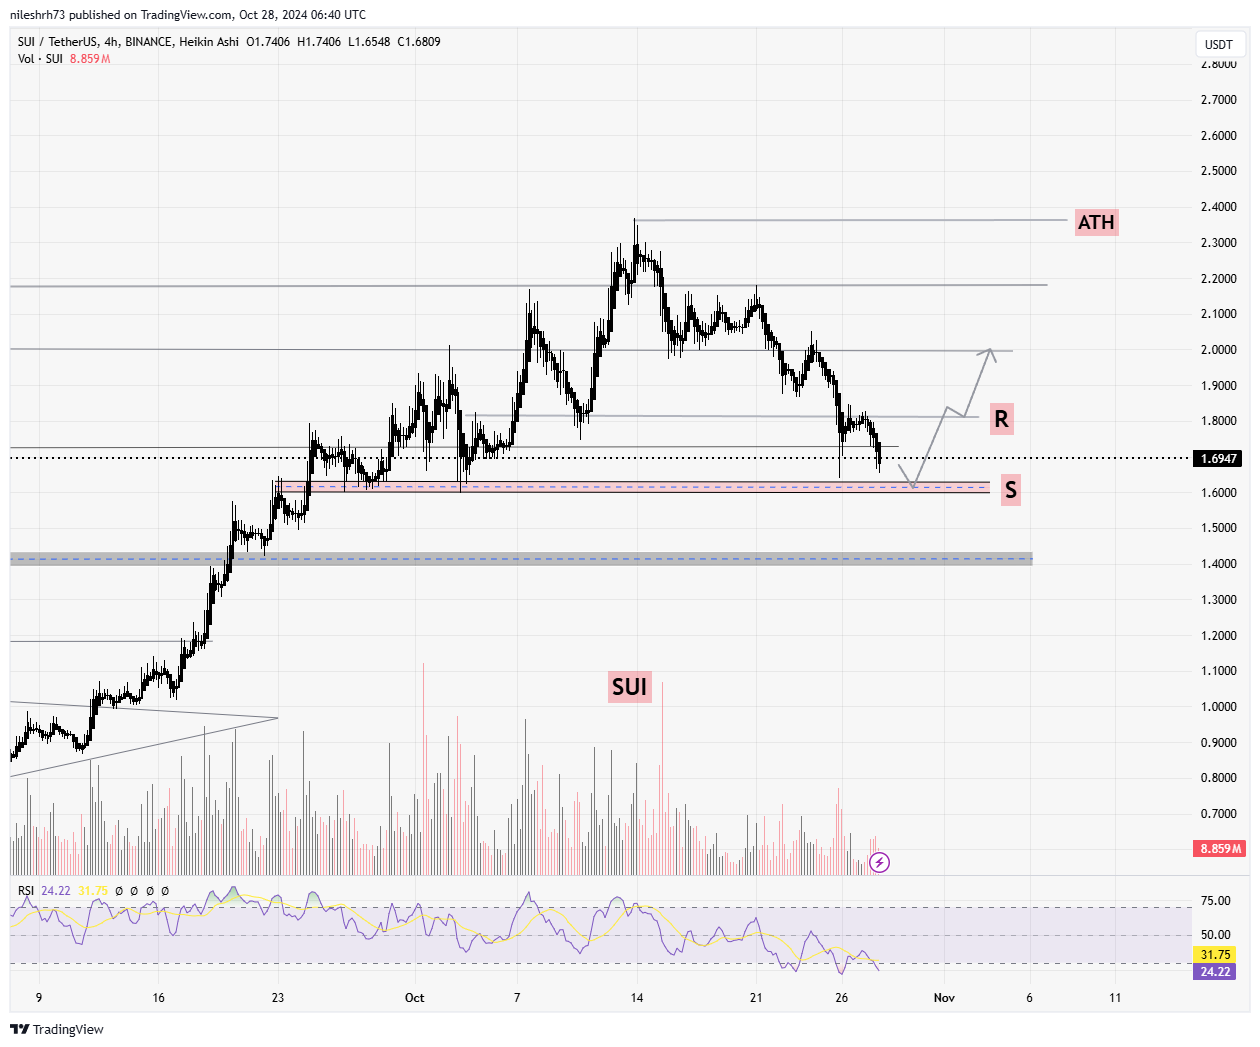
SUI is currently trading around $1.69, significantly below its recent peak. Based on the 4-hour chart, SUI has failed to hold resistance level at $1.80 and seems to be moving toward a lower support level (S) near the $1.61 range. This level has previously served as a strong demand zone, making it a crucial area to watch.

The Relative Strength Index (RSI) on SUI’s chart has dropped to around 24, indicating an oversold condition, which could hint at a potential bounce or at least a temporary consolidation around the support zone. If SUI can hold this support level, there is a possibility for a bullish reversal toward the resistance zone (R) at around $1.80, with a medium-term target potentially at $2.0.
Key Levels:
- Support (S): $1.59 – $1.62
- Resistance (R): $1.80 – $2.0
- All-Time High (ATH): $2.36
Aptos (APT) Analysis:
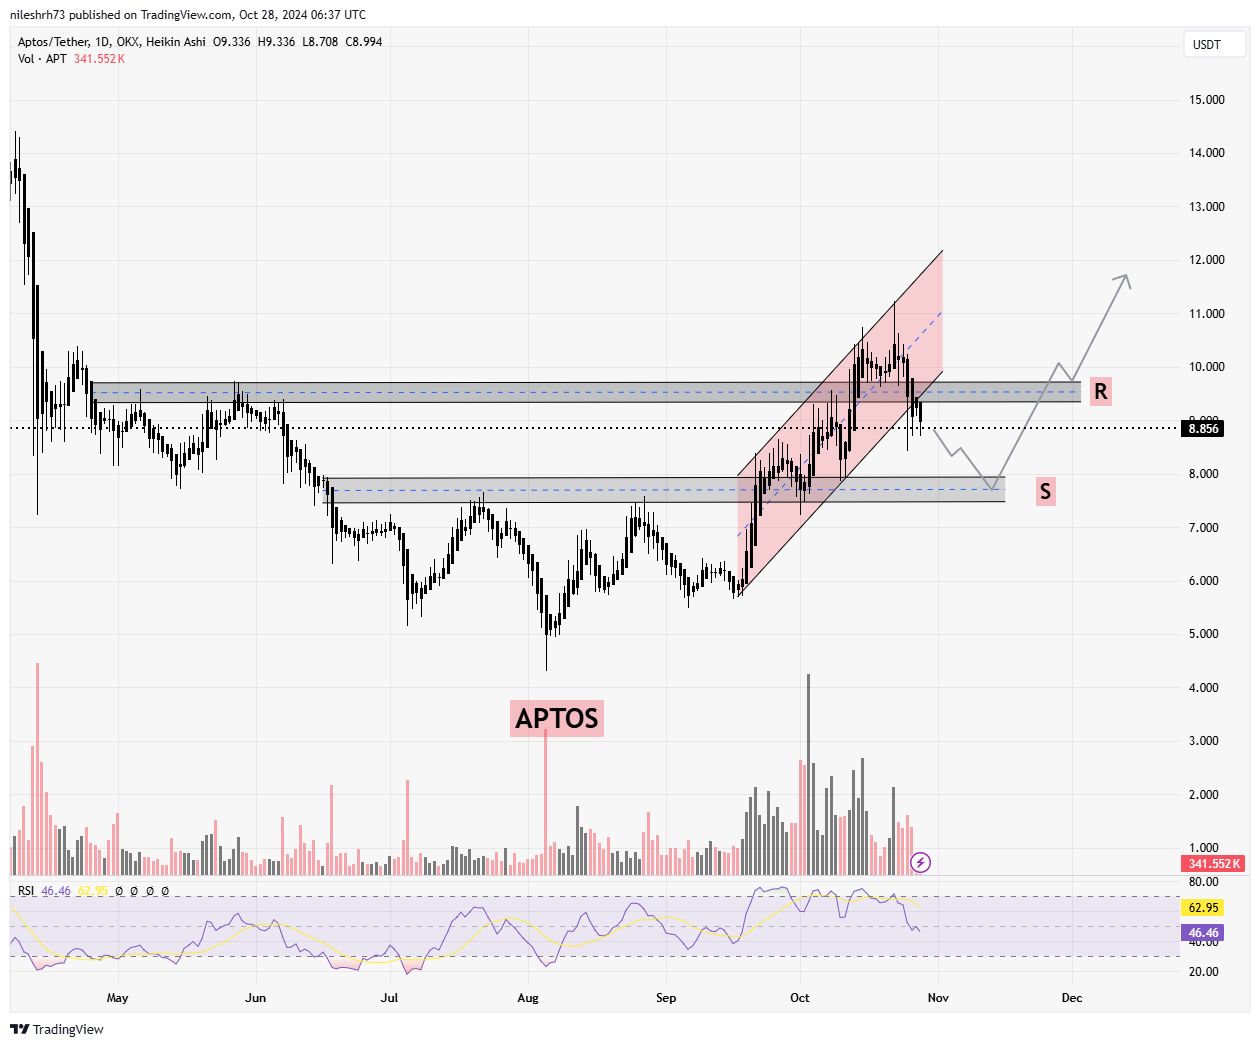
APT is currently trading around $8.99, and recent price action shows that it’s been moving within a defined uptrend channel, which was breached during this decline. The daily chart reveals that APT is approaching a strong support level (S) near $7.70, which previously acted as a springboard for upward movements. The RSI for APT is currently at 46, a neutral level that doesn’t suggest strong oversold or overbought conditions, giving room for potential downside testing before a reversal.

If APT bounces off the $7.70 support level, we could see a recovery back towards the $9.71- $11.18 resistance area (R). However, if the support fails, APT might head lower to test the $7.50 level.
Key Levels:
- Support (S): $7.46- $7.93
- Resistance (R): $9.71- $11.18
- All-Time High (ATH): $11.22
What to Expect Ahead?
Based on both charts, it appears that SUI and APT have more room for correction, potentially testing their respective support levels (S). If these levels are reached and held, there’s a strong probability of a significant upside move, possibly setting the stage for a new rally after a healthy correction. Investors may want to keep an eye on these support zones for potential entry points, as these could mark the end of the current downtrend.
Disclaimer: This article is for informational purposes only and not financial advice. Always conduct your own research before investing in cryptocurrencies.


