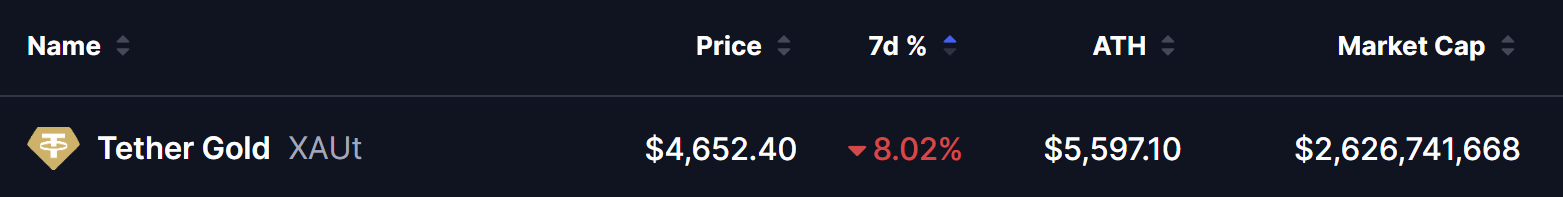
- Tether Gold (XAUT) is trading at $4,652.40, down 8.02% over the past 7 days and 16.9% below its all-time high of $5,597.10.
- Key support zone sits at $4,515–$4,656 — a level that must hold to keep the bullish fractal intact.
- Invalidation level: $4,433 — a daily close below this level cancels the bullish setup.
- If the fractal plays out, XAUT's next targets are $5,454, $5,603, and $5,774.
- Tether Gold's market capitalization stands at approximately $2.63 billion — the largest tokenized gold RWA in crypto.
Tether Gold (XAUT) is currently trading at $4,652.40 as of March 20, 2026, with a market capitalization of approximately $2.63 billion — maintaining its position as the largest tokenized gold asset in the cryptocurrency market.
The token has pulled back 8.02% over the past 7 days, retracing from its all-time high of $5,597.10 reached earlier in 2026 during the peak of safe-haven demand driven by the ongoing US-Israel-Iran geopolitical conflict. Despite the short-term pullback, XAUT remains up significantly from its December 2025 levels, reflecting the broader gold market’s strength amid persistent macroeconomic uncertainty.
At current prices, XAUT sits approximately 16.9% below its all-time high — a relatively shallow correction compared to most crypto assets, consistent with gold’s reputation as a low-volatility store of value. The key question now is whether this pullback represents a healthy consolidation before the next leg higher, or the beginning of a more significant correction.
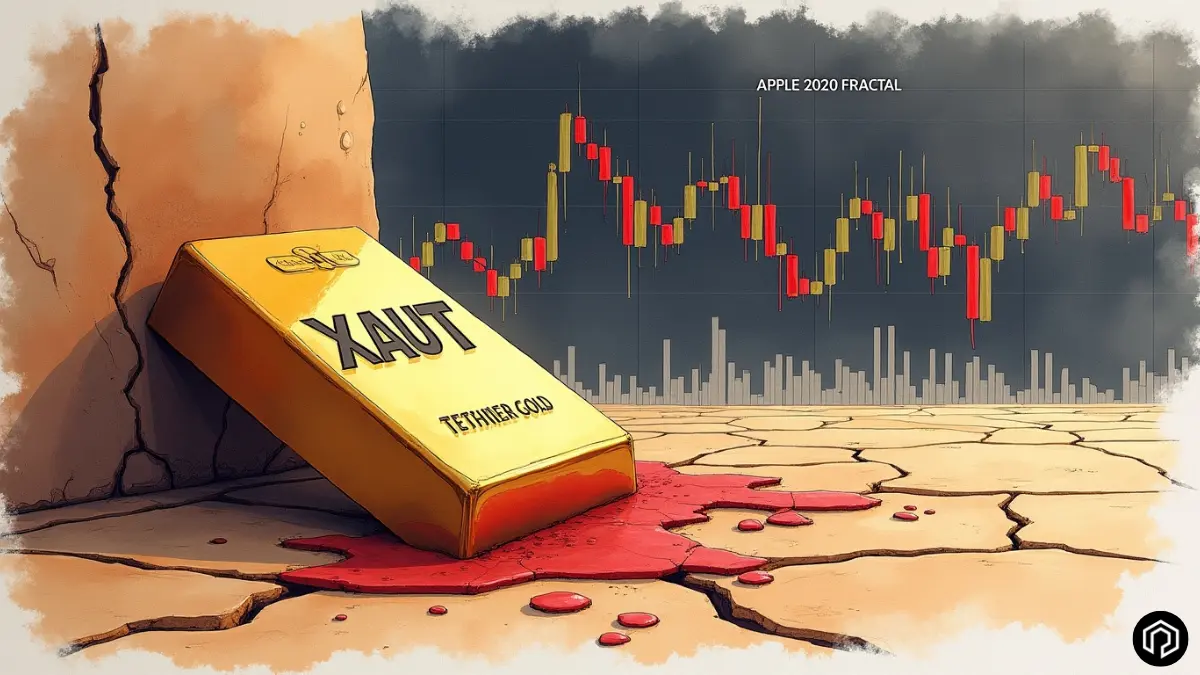
2. The Apple 2020 Fractal — A Powerful Historical Parallel
The most compelling aspect of XAUT’s current setup is a striking structural similarity between its price action and Apple Inc. (AAPL) during November 2020 — a period that preceded one of Apple’s most powerful breakout moves.
The side-by-side comparison reveals the following parallels:
Apple — November 2020:
- Price consolidated in a tight range after an initial surge
- Pulled back toward the $89.15 base level (Fibonacci 0)
- Consolidated between $110–$138 for several weeks
- Eventually broke above $137.98 (Fibonacci 1) with momentum
- Extended to $144.33 (Fibonacci 1.13 extension) — a 13% move above the prior high
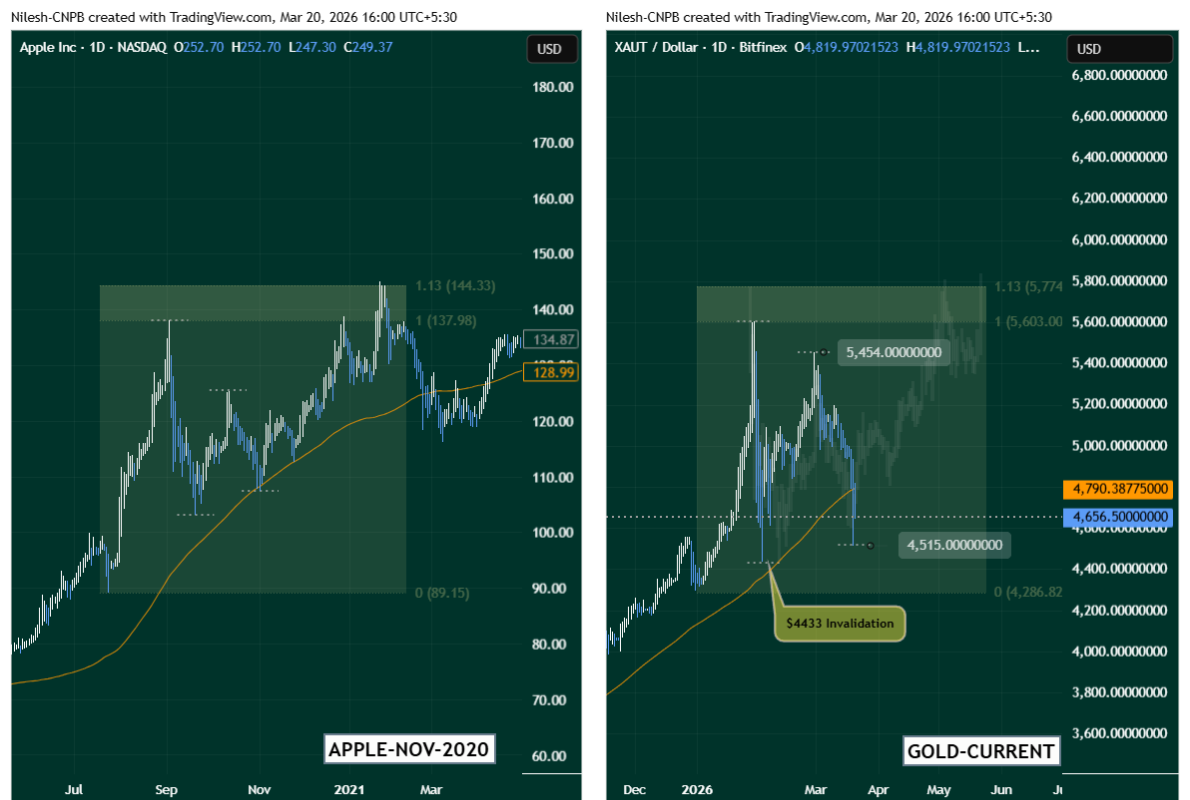
XAUT — Current (March 2026):
- Price surged to an all-time high of $5,597.10 then pulled back
- Currently consolidating with $4,286.82 as the Fibonacci 0 base
- Trading between $4,515 and $5,603 — mirroring Apple’s consolidation range
- $5,603 (Fibonacci 1) is the key breakout level to reclaim
- If the fractal holds, the 1.13 Fibonacci extension projects to $5,774
The fractal comparison is not a guarantee of future performance — Apple is a tech stock and XAUT is a tokenized commodity with different market drivers. However, the structural similarity in price behavior suggests that XAUT may be in a similar accumulation phase that could precede a breakout to new all-time highs.
What’s Next for XAUT?
Tether Gold sits at a pivotal juncture. The macro backdrop remains strongly supportive — gold continues to trade above $3,000/oz in spot markets amid the ongoing US-Israel-Iran conflict, persistent inflation concerns, and central bank buying at record levels globally. These fundamentals provide a strong floor for XAUT demand.
Bullish Scenario
For the bullish fractal to play out, XAUT needs to:
Step 1 — Continue to hold above $4,433 and $4,515 support. These two levels form the critical base of the current structure. As long as XAUT maintains daily closes above both $4,433 (the invalidation level) and $4,515 (the lower support boundary), the Apple fractal comparison remains valid and the consolidation structure stays intact.
Step 2 — Reclaim the 100 MA at $4,790. The 100-day moving average sitting at $4,790 is the first meaningful recovery target and a key indicator of momentum shifting from bearish to neutral. A sustained daily close above $4,790 would signal that buyers have regained control and mirror Apple’s reclaim of its moving average during the 2020 accumulation phase.
Step 3 — Break above $5,454 then $5,603. Sequential reclaim of these resistance levels would confirm the fractal is playing out. The $5,603 level — equivalent to the prior all-time high — is the critical confirmation point. A weekly close above this level would open the door to the $5,774 Fibonacci extension target and a new all-time high for tokenized gold.
The broader geopolitical environment continues to support gold demand. As long as the US-Israel-Iran conflict drives uncertainty in energy markets and global risk appetite remains suppressed, safe-haven flows into gold — and by extension XAUT — are likely to remain elevated.
Bearish Scenario
If XAUT fails to hold the current support zone, the invalidation level at $4,433 becomes the critical threshold. A daily close below this level would:
- Cancel the Apple fractal comparison entirely
- Suggest the pullback from the all-time high has deeper to go
- Open the door toward the $4,286 Fibonacci 0 base level — a further 8% decline from current prices
- Potentially extend toward the $4,000 psychological support if selling accelerates
The bearish case would be reinforced by any de-escalation in the Middle East conflict, a sharp recovery in risk assets, or unexpected strength in the US dollar — all of which have historically reduced safe-haven demand for gold.
Frequently Asked Questions
What is Tether Gold (XAUT) and how does it track gold prices?
ether Gold (XAUT) is a tokenized gold asset issued by Tether, where each token represents one troy ounce of physical gold held in audited Swiss vaults. Its price tracks the spot price of gold directly, making it the on-chain equivalent of holding physical gold. With a market cap of $2.63 billion, it is the largest tokenized gold RWA in the cryptocurrency market.
What is a fractal pattern in technical analysis?
A fractal pattern occurs when a current asset’s price structure closely mirrors the historical price action of another asset or a prior cycle of the same asset. Traders use fractals to identify potential future price behavior based on structural similarities. While fractals provide useful probabilistic frameworks, they are not guarantees — confirmation always requires the price to follow through.
Why is the Apple 2020 fractal relevant for XAUT?
Both Apple in November 2020 and XAUT currently share a similar structural pattern: an initial surge to a high, followed by a controlled pullback into a consolidation zone, with Fibonacci levels aligning at similar ratios. Apple’s fractal resulted in a breakout to the 1.13 Fibonacci extension. If XAUT follows the same structure, the equivalent target would be $5,774.
What is the $4,433 invalidation level and why does it matter?
The $4,433 level represents the point at which the current consolidation structure breaks down. A daily close below this level would suggest the pullback from the all-time high is not a normal retracement but a deeper correction — invalidating the bullish fractal thesis and pointing toward lower support levels near $4,286.
What macro factors are supporting gold and XAUT in 2026?
Several macro factors are driving gold demand in 2026: the ongoing US-Israel-Iran conflict creating geopolitical uncertainty, persistent global inflation keeping real interest rates suppressed, record central bank gold purchases, and increased institutional demand for tokenized gold as a 24/7 tradeable safe-haven asset on crypto exchanges.

The opinions and market insights shared on CoinsProbe represent the views of individual authors based on prevailing market conditions at the time of publication. Cryptocurrency investments carry significant risk and volatility. Readers are encouraged to conduct their own research and seek professional financial advice before making investment decisions. CoinsProbe and its contributors do not accept responsibility for financial losses or decisions made based on published content.
CoinsProbe may publish sponsored articles, affiliate links, or promotional collaborations. All sponsored material is clearly labeled to maintain transparency with our audience. Our editorial decisions remain fully independent, and advertising partnerships do not influence reviews, rankings, or published opinions.
Since 2023, CoinsProbe has delivered reliable insights on cryptocurrency, blockchain, and digital assets. Our content is created by experienced researchers and analysts who follow strict editorial standards focused on accuracy, transparency, and credibility. Every article is carefully reviewed and verified using trusted sources and current market data. We provide unbiased analysis and timely updates covering everything from emerging crypto projects to major industry developments.