
Date: Tue, May 13, 2025 | 06:45 AM GMT
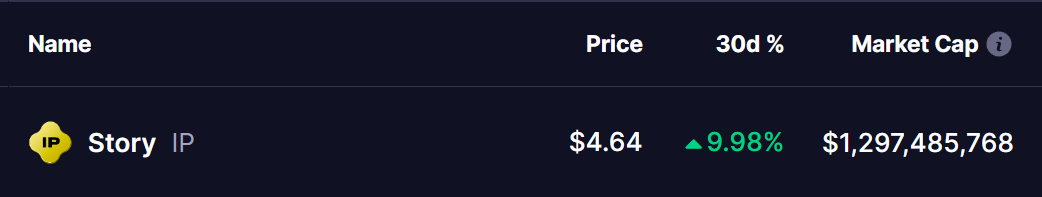
The cryptocurrency market continues to ride a wave of optimism, with Ethereum (ETH) leading the charge. ETH has rallied over 51% in the past month, recently crossing the $2,450 mark — a level not seen in months. This resurgence is also helping to lift sentiment across major altcoins, including Story (IP), which was lagging behind. Now, it looks ready to catch up.
While IP has posted a 9% gain this month, a key harmonic pattern forming on the chart suggests that more upside may be on the way.
Harmonic Pattern Hints at Bullish Continuation
On the daily chart, IP is displaying a Bearish Bat harmonic pattern — a technical setup known for its reliability in forecasting strong upward price movement until the pattern completes. This pattern is currently in the CD leg, which is typically bullish until point D is reached.
The move began with a sharp rejection near $6.60 on March 25, which marked the start of the XA leg. Price then dropped significantly to a low of $2.98 on April 14, forming point A. From there, it recovered to $3.87, retracing 34.8% of the XA leg, which is within the ideal range for this pattern. The price then pulled back again to around $3.43, marking point C with a 64.6% retracement of the AB leg.
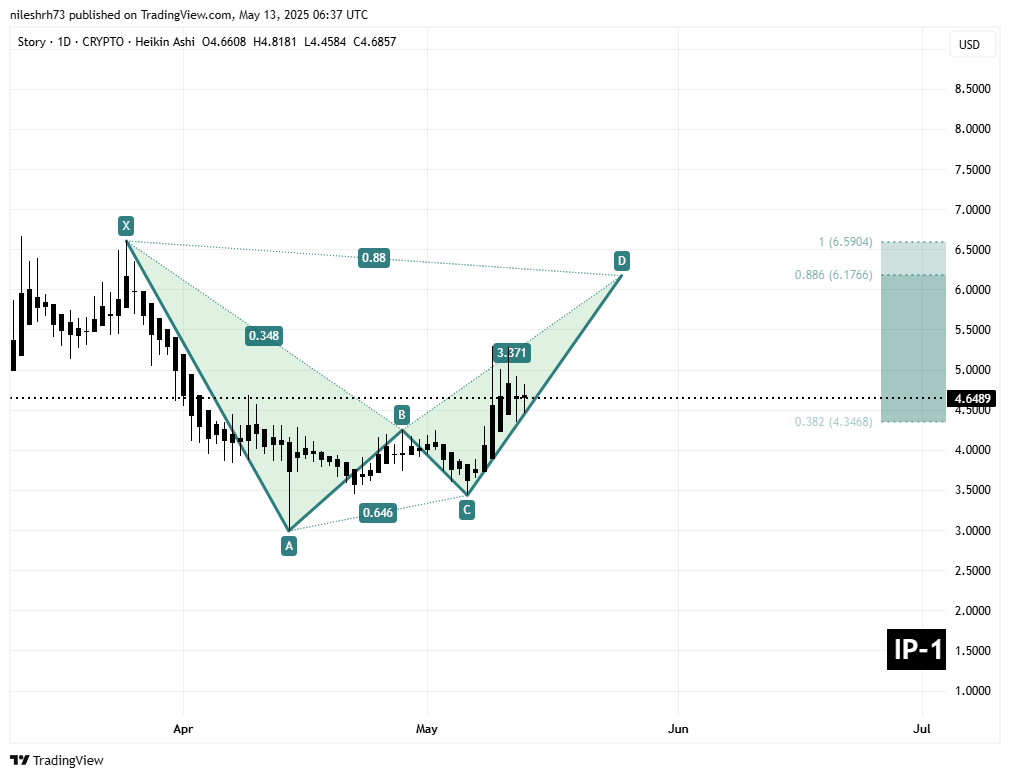
Currently, IP is moving higher in the CD leg. The projected completion zone for point D is near $6.18, aligning with the 0.886 Fibonacci retracement of the XA leg. This level is significant, as it often acts like a price magnet during bullish moves, while also serving as a potential reversal zone once reached.
What’s Next for IP?
With IP now trading around $4.65, there is a potential 33% upside if the price reaches the $6.18 target. Should bullish momentum remain strong, the token may even attempt to retest the March high of $6.60.
On the downside, immediate support is seen near $4.34, which represents the 0.382 Fibonacci level and has recently acted as a strong price floor. This level will be crucial in maintaining bullish sentiment as IP continues its move higher.
Traders should closely monitor the $6.16 to $6.60 region. This is not only the projected completion zone for the harmonic pattern but also a logical area where some traders may begin to take profits. A pullback is possible if the broader market cools down, so risk management remains essential.
Disclaimer: This article is for informational purposes only and not financial advice. Always conduct your own research before investing in cryptocurrencies.

The opinions and market insights shared on CoinsProbe represent the views of individual authors based on prevailing market conditions at the time of publication. Cryptocurrency investments carry significant risk and volatility. Readers are encouraged to conduct their own research and seek professional financial advice before making investment decisions. CoinsProbe and its contributors do not accept responsibility for financial losses or decisions made based on published content.
CoinsProbe may publish sponsored articles, affiliate links, or promotional collaborations. All sponsored material is clearly labeled to maintain transparency with our audience. Our editorial decisions remain fully independent, and advertising partnerships do not influence reviews, rankings, or published opinions.
Since 2023, CoinsProbe has delivered reliable insights on cryptocurrency, blockchain, and digital assets. Our content is created by experienced researchers and analysts who follow strict editorial standards focused on accuracy, transparency, and credibility. Every article is carefully reviewed and verified using trusted sources and current market data. We provide unbiased analysis and timely updates covering everything from emerging crypto projects to major industry developments.