
Date: Wed, Jan 01, 2025, 06:03 AM GMT
The cryptocurrency market has started the new year with signs of recovery following December’s significant correction. Bitcoin (BTC), which hit an all-time high of $108,000, has now retraced to levels above $93,000. This bearish wave affected top altcoins, including Stellar (XLM), which saw a pullback after an impressive rally in November.
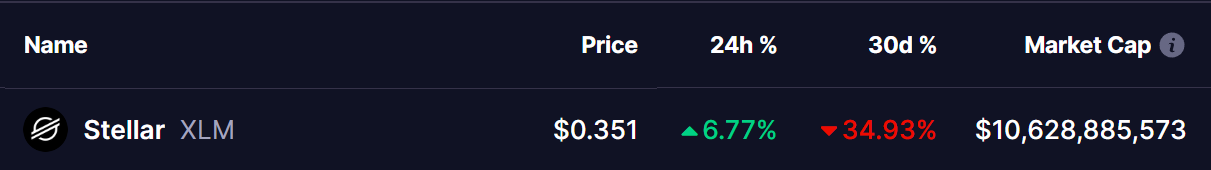
However, amid the recent correction, XLM’s monthly gains have shrunk to almost 35%, but today, the token is regaining momentum with a notable 6% gain as it approaches a potential breakout.
XLM’s Technical Setup: Falling Wedge Pattern in Focus
XLM’s recent decline stemmed from a rejection at the $0.63 resistance level, which marks the upper boundary of a falling wedge pattern (as shown in the chart). This pullback led to several tests of the wedge’s lower support level, highlighting strong buy demand near these zones.
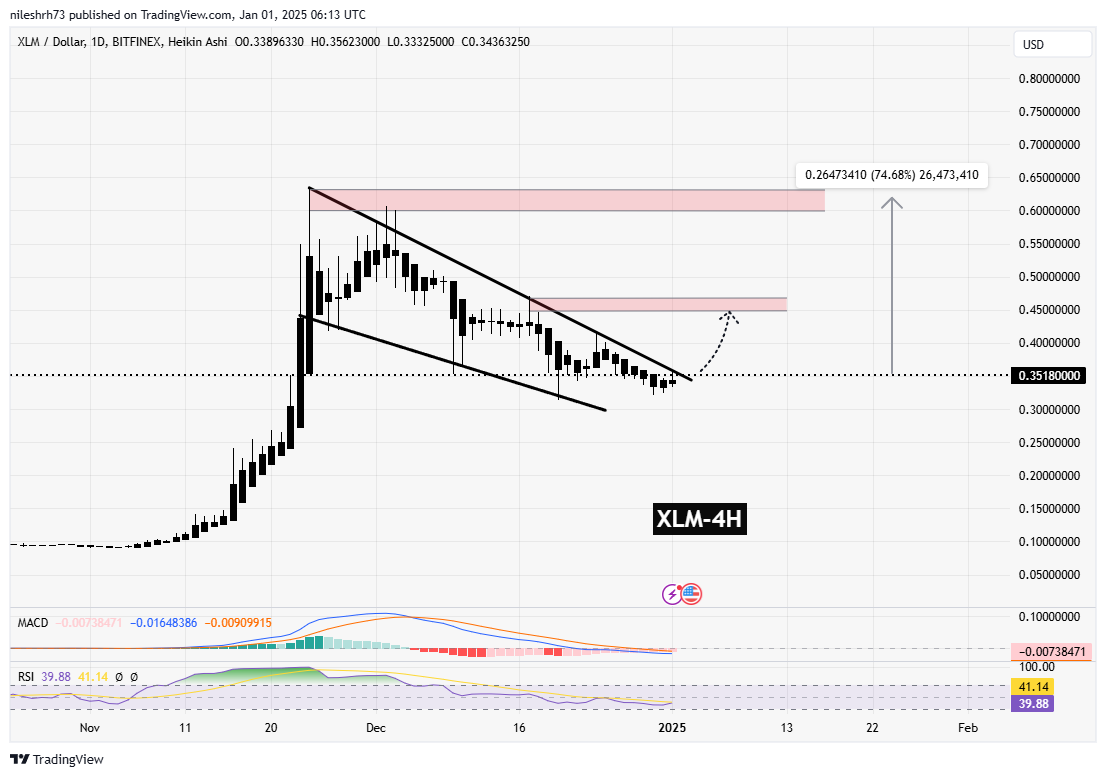
Currently, XLM has shown a sharp bounce off the wedge’s lower boundary and is now trading at $0.3518, close to the wedge’s converging point. Historically, falling wedge patterns indicate a potential bullish breakout, and XLM seems to be following this textbook setup.
The MACD (Moving Average Convergence Divergence) histogram is gradually moving upward, signaling that the bearish momentum is starting to fade. A potential crossover in the MACD lines could further confirm the emergence of a bullish trend in the upcoming sessions.
Similarly, the RSI (Relative Strength Index) is recovering from oversold levels and is currently at 41, indicating increasing buying pressure. This growing momentum could bolster XLM’s chances of breaking out above the wedge’s upper resistance, paving the way for further upside.
What’s Next for XLM?
If XLM can sustain its current momentum and break above the $0.3524 resistance, it could target higher levels at $0.46 and eventually $0.63. These levels represent a potential 74% gain from the current price, as indicated in the chart.
However, failure to break out of the wedge could result in another retest of the lower support zone around $0.33. Traders should closely monitor these levels for directional clarity.
Conclusion
XLM is showing promising signs of recovery as it gains momentum near the wedge’s breakout zone. With bullish signals from the MACD and RSI, the token has the potential to challenge its next resistance levels. However, a confirmed breakout is crucial for sustained upward movement.

Disclaimer: This article is for informational purposes only and not financial advice. Always conduct your own research before investing in cryptocurrencies.

The opinions and market insights shared on CoinsProbe represent the views of individual authors based on prevailing market conditions at the time of publication. Cryptocurrency investments carry significant risk and volatility. Readers are encouraged to conduct their own research and seek professional financial advice before making investment decisions. CoinsProbe and its contributors do not accept responsibility for financial losses or decisions made based on published content.
CoinsProbe may publish sponsored articles, affiliate links, or promotional collaborations. All sponsored material is clearly labeled to maintain transparency with our audience. Our editorial decisions remain fully independent, and advertising partnerships do not influence reviews, rankings, or published opinions.
Since 2023, CoinsProbe has delivered reliable insights on cryptocurrency, blockchain, and digital assets. Our content is created by experienced researchers and analysts who follow strict editorial standards focused on accuracy, transparency, and credibility. Every article is carefully reviewed and verified using trusted sources and current market data. We provide unbiased analysis and timely updates covering everything from emerging crypto projects to major industry developments.