Key Takeaways
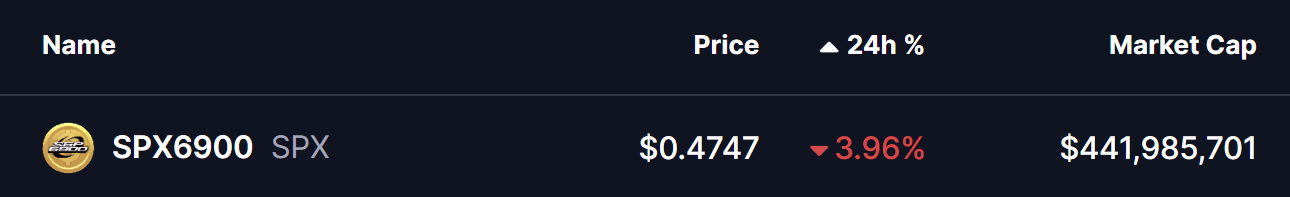
- SPX6900 (SPX) has dropped over 4% amid broader crypto market weakness and rising liquidation pressure.
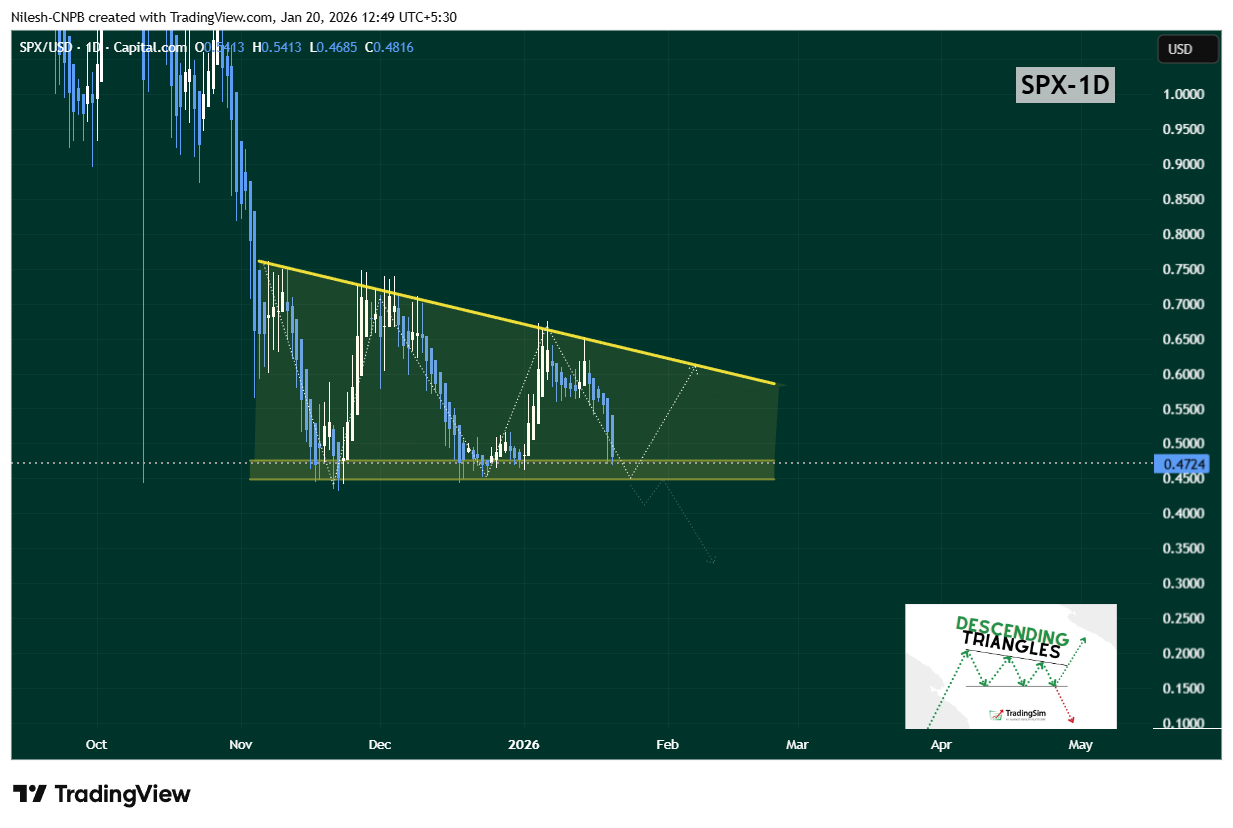
- The daily chart shows SPX trading inside a descending triangle pattern, with price compressing toward a critical support zone.
- Buyers continue to defend the $0.44–$0.4775 demand area, preventing a confirmed bearish breakdown so far.
- A rebound from current levels could push SPX toward the descending resistance near $0.61.
- A decisive breakdown below $0.44 would invalidate the support and expose SPX to further downside.
The broader cryptocurrency market is in slight under pressure on January 20, with risk sentiment turning cautious once again. Bitcoin (BTC) and Ethereum (ETH) are both trading lower, down 1.69% and 2.45% respectively over the past 24 hours. This sharp move triggered more than $286 million in liquidations, with long positions absorbing the bulk of the damage.
As volatility spreads across the market, memecoins have also felt the heat. SPX6900 (SPX) has dropped near 4%, sliding back toward a technically important area on the daily chart. However, while price action looks weak on the surface, the chart suggests SPX may be approaching a make-or-break zone that could define its next major move.
Descending Triangle Takes Shape on the Daily Chart
From a technical perspective, SPX is trading within a large descending triangle pattern on the daily timeframe. This formation is defined by a series of lower highs pressing against a relatively flat support zone — a structure that often reflects growing selling pressure.
Descending triangles are typically considered bearish, but context matters. When price repeatedly tests a strong base without breaking down, it can also signal accumulation rather than distribution.
In SPX’s case, price has once again dipped into the key demand zone between $0.44 and $0.4775. This area has acted as a reliable support throughout recent months, consistently attracting buyers whenever price revisits it. Each test of this zone has produced long lower wicks, highlighting aggressive dip-buying and a reluctance from sellers to push price lower.
Can Buyers Defend the Base?
As long as SPX holds above the $0.44–$0.4775 support region, the descending triangle remains intact without confirmation of a breakdown. A successful defense here could trigger a relief bounce, potentially sending price back toward the upper trendline resistance near $0.61.
This descending resistance has rejected price multiple times, making it a critical level to watch. A breakout above it would mark a meaningful shift in structure and could signal that buyers are regaining control after weeks of compression.
That said, downside risk cannot be ignored. A decisive daily or weekly close below $0.44 would invalidate the support base and confirm a bearish breakdown from the triangle. Such a move could open the door for a deeper correction as trapped buyers exit positions.
Bottom Line
SPX6900 is currently sitting at a pivotal technical crossroads. While broader market weakness has pushed price lower, the daily chart shows that SPX is testing a well-defined demand zone that has consistently held in the past.
As long as buyers continue to defend the triangle’s base, a rebound toward descending resistance remains a realistic scenario. However, a failure to hold support would shift momentum firmly back in favor of sellers.
Disclaimer: The views and analysis presented in this article are for informational purposes only and reflect the author’s perspective, not financial advice. Technical patterns and indicators discussed are subject to market volatility and may or may not yield the anticipated results. Investors are advised to exercise caution, conduct independent research, and make decisions aligned with their individual risk tolerance.
About Author: Nilesh Hembade is the Founder and Lead Author of Coinsprobe, with over 5 years of experience in the cryptocurrency and blockchain industry. Since launching Coinsprobe in 2023, he has been providing daily, research-driven insights through in-depth market analysis, on-chain data, and technical research.

The opinions and market insights shared on CoinsProbe represent the views of individual authors based on prevailing market conditions at the time of publication. Cryptocurrency investments carry significant risk and volatility. Readers are encouraged to conduct their own research and seek professional financial advice before making investment decisions. CoinsProbe and its contributors do not accept responsibility for financial losses or decisions made based on published content.
CoinsProbe may publish sponsored articles, affiliate links, or promotional collaborations. All sponsored material is clearly labeled to maintain transparency with our audience. Our editorial decisions remain fully independent, and advertising partnerships do not influence reviews, rankings, or published opinions.
Since 2023, CoinsProbe has delivered reliable insights on cryptocurrency, blockchain, and digital assets. Our content is created by experienced researchers and analysts who follow strict editorial standards focused on accuracy, transparency, and credibility. Every article is carefully reviewed and verified using trusted sources and current market data. We provide unbiased analysis and timely updates covering everything from emerging crypto projects to major industry developments.