Date: Mon, Nov 17, 2025 | 06:00 AM GMT
The broader altcoin market continues to witness sharp downside volatility as Ethereum (ETH) extends its 30-day correction beyond 17%, weighing heavily on major altcoins — including Solana (SOL).
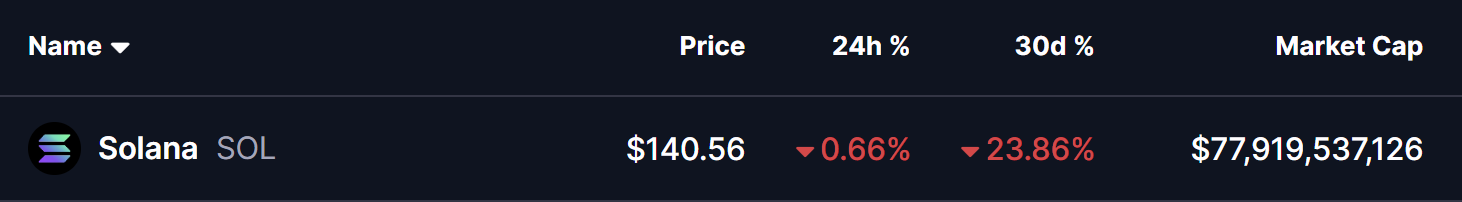
SOL has dropped nearly 23% over the past month, but beneath the price weakness, something far more constructive is forming. A clean harmonic pattern is emerging on the chart, suggesting that a potential rebound may be closer than many expect.
Harmonic Pattern Signals More Upside
On the 4-hour timeframe, SOL is shaping up a Bearish Cypher harmonic pattern — a structure known for generating upside momentum during its final CD-leg, before completing at the Potential Reversal Zone (PRZ).
The pattern began at Point X around $205.12, followed by a sharp decline into Point A, a corrective rebound to Point B, and finally a deeper leg lower into Point C near $134.44. From this low, Solana has begun to recover gradually and is currently trading around $140.55, reflecting early signs of stability and strengthening buyer interest.
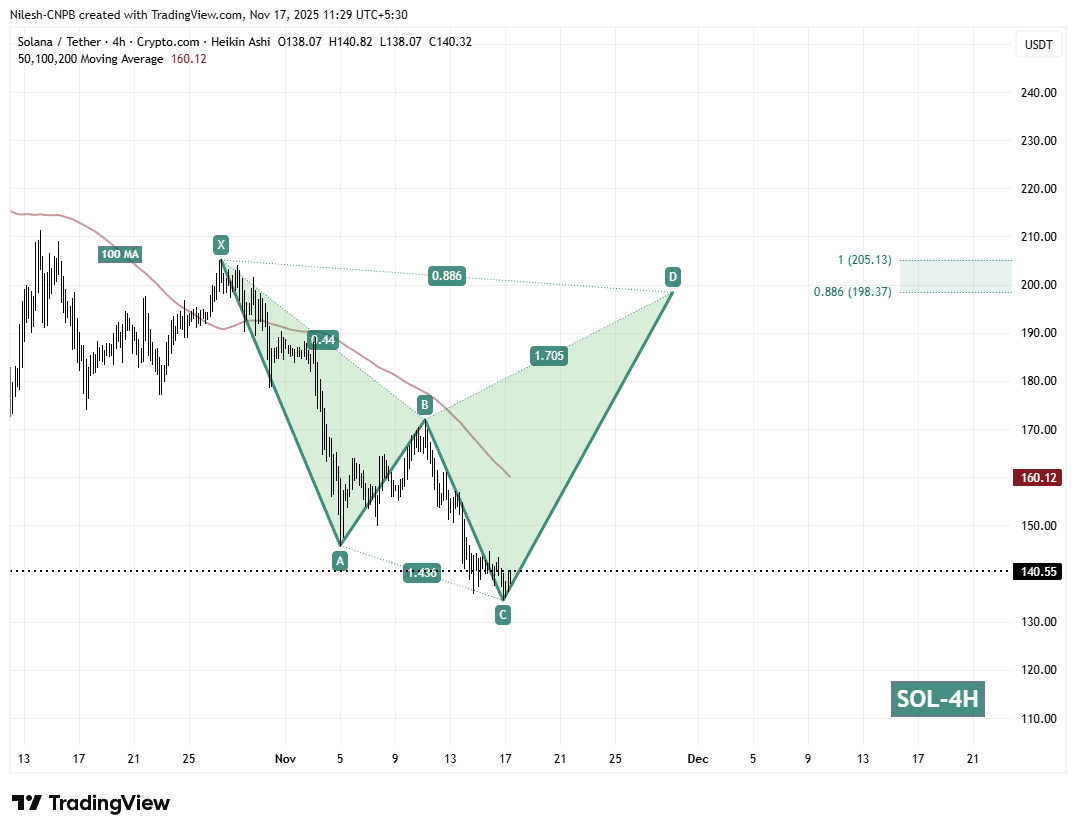
Additional support for this move comes from the 100-hour moving average, sitting near $160.12 — a key dynamic resistance that bulls will need to reclaim to validate a stronger trend recovery ahead.
What’s Next for SOL?
The most critical level in the short term is the C-support near $134.44. Holding above this zone keeps the harmonic pattern active and preserves the bullish potential.
If SOL maintains this support and pushes higher, the next major hurdle will be reclaiming the 100-hour moving average ($160.12). A decisive break above this level would further confirm momentum and likely accelerate the CD-leg toward the upside.
Based on the harmonic structure, SOL’s path points toward the Potential Reversal Zone (PRZ) between $198.37 (0.886 Fibonacci extension) & $205.13 (1.0 Fibonacci extension). This region marks where the cypher pattern is expected to complete and where larger resistance or potential trend reversal could occur.
However, if SOL falls below $134.44, the bullish structure weakens significantly, opening the door for deeper downside tests before any meaningful recovery attempt can develop.
Disclaimer: The views and analysis presented in this article are for informational purposes only and reflect the author’s perspective, not financial advice. Technical patterns and indicators discussed are subject to market volatility and may or may not yield the anticipated results. Investors are advised to exercise caution, conduct independent research, and make decisions aligned with their individual risk tolerance.

The opinions and market insights shared on CoinsProbe represent the views of individual authors based on prevailing market conditions at the time of publication. Cryptocurrency investments carry significant risk and volatility. Readers are encouraged to conduct their own research and seek professional financial advice before making investment decisions. CoinsProbe and its contributors do not accept responsibility for financial losses or decisions made based on published content.
CoinsProbe may publish sponsored articles, affiliate links, or promotional collaborations. All sponsored material is clearly labeled to maintain transparency with our audience. Our editorial decisions remain fully independent, and advertising partnerships do not influence reviews, rankings, or published opinions.
Since 2023, CoinsProbe has delivered reliable insights on cryptocurrency, blockchain, and digital assets. Our content is created by experienced researchers and analysts who follow strict editorial standards focused on accuracy, transparency, and credibility. Every article is carefully reviewed and verified using trusted sources and current market data. We provide unbiased analysis and timely updates covering everything from emerging crypto projects to major industry developments.